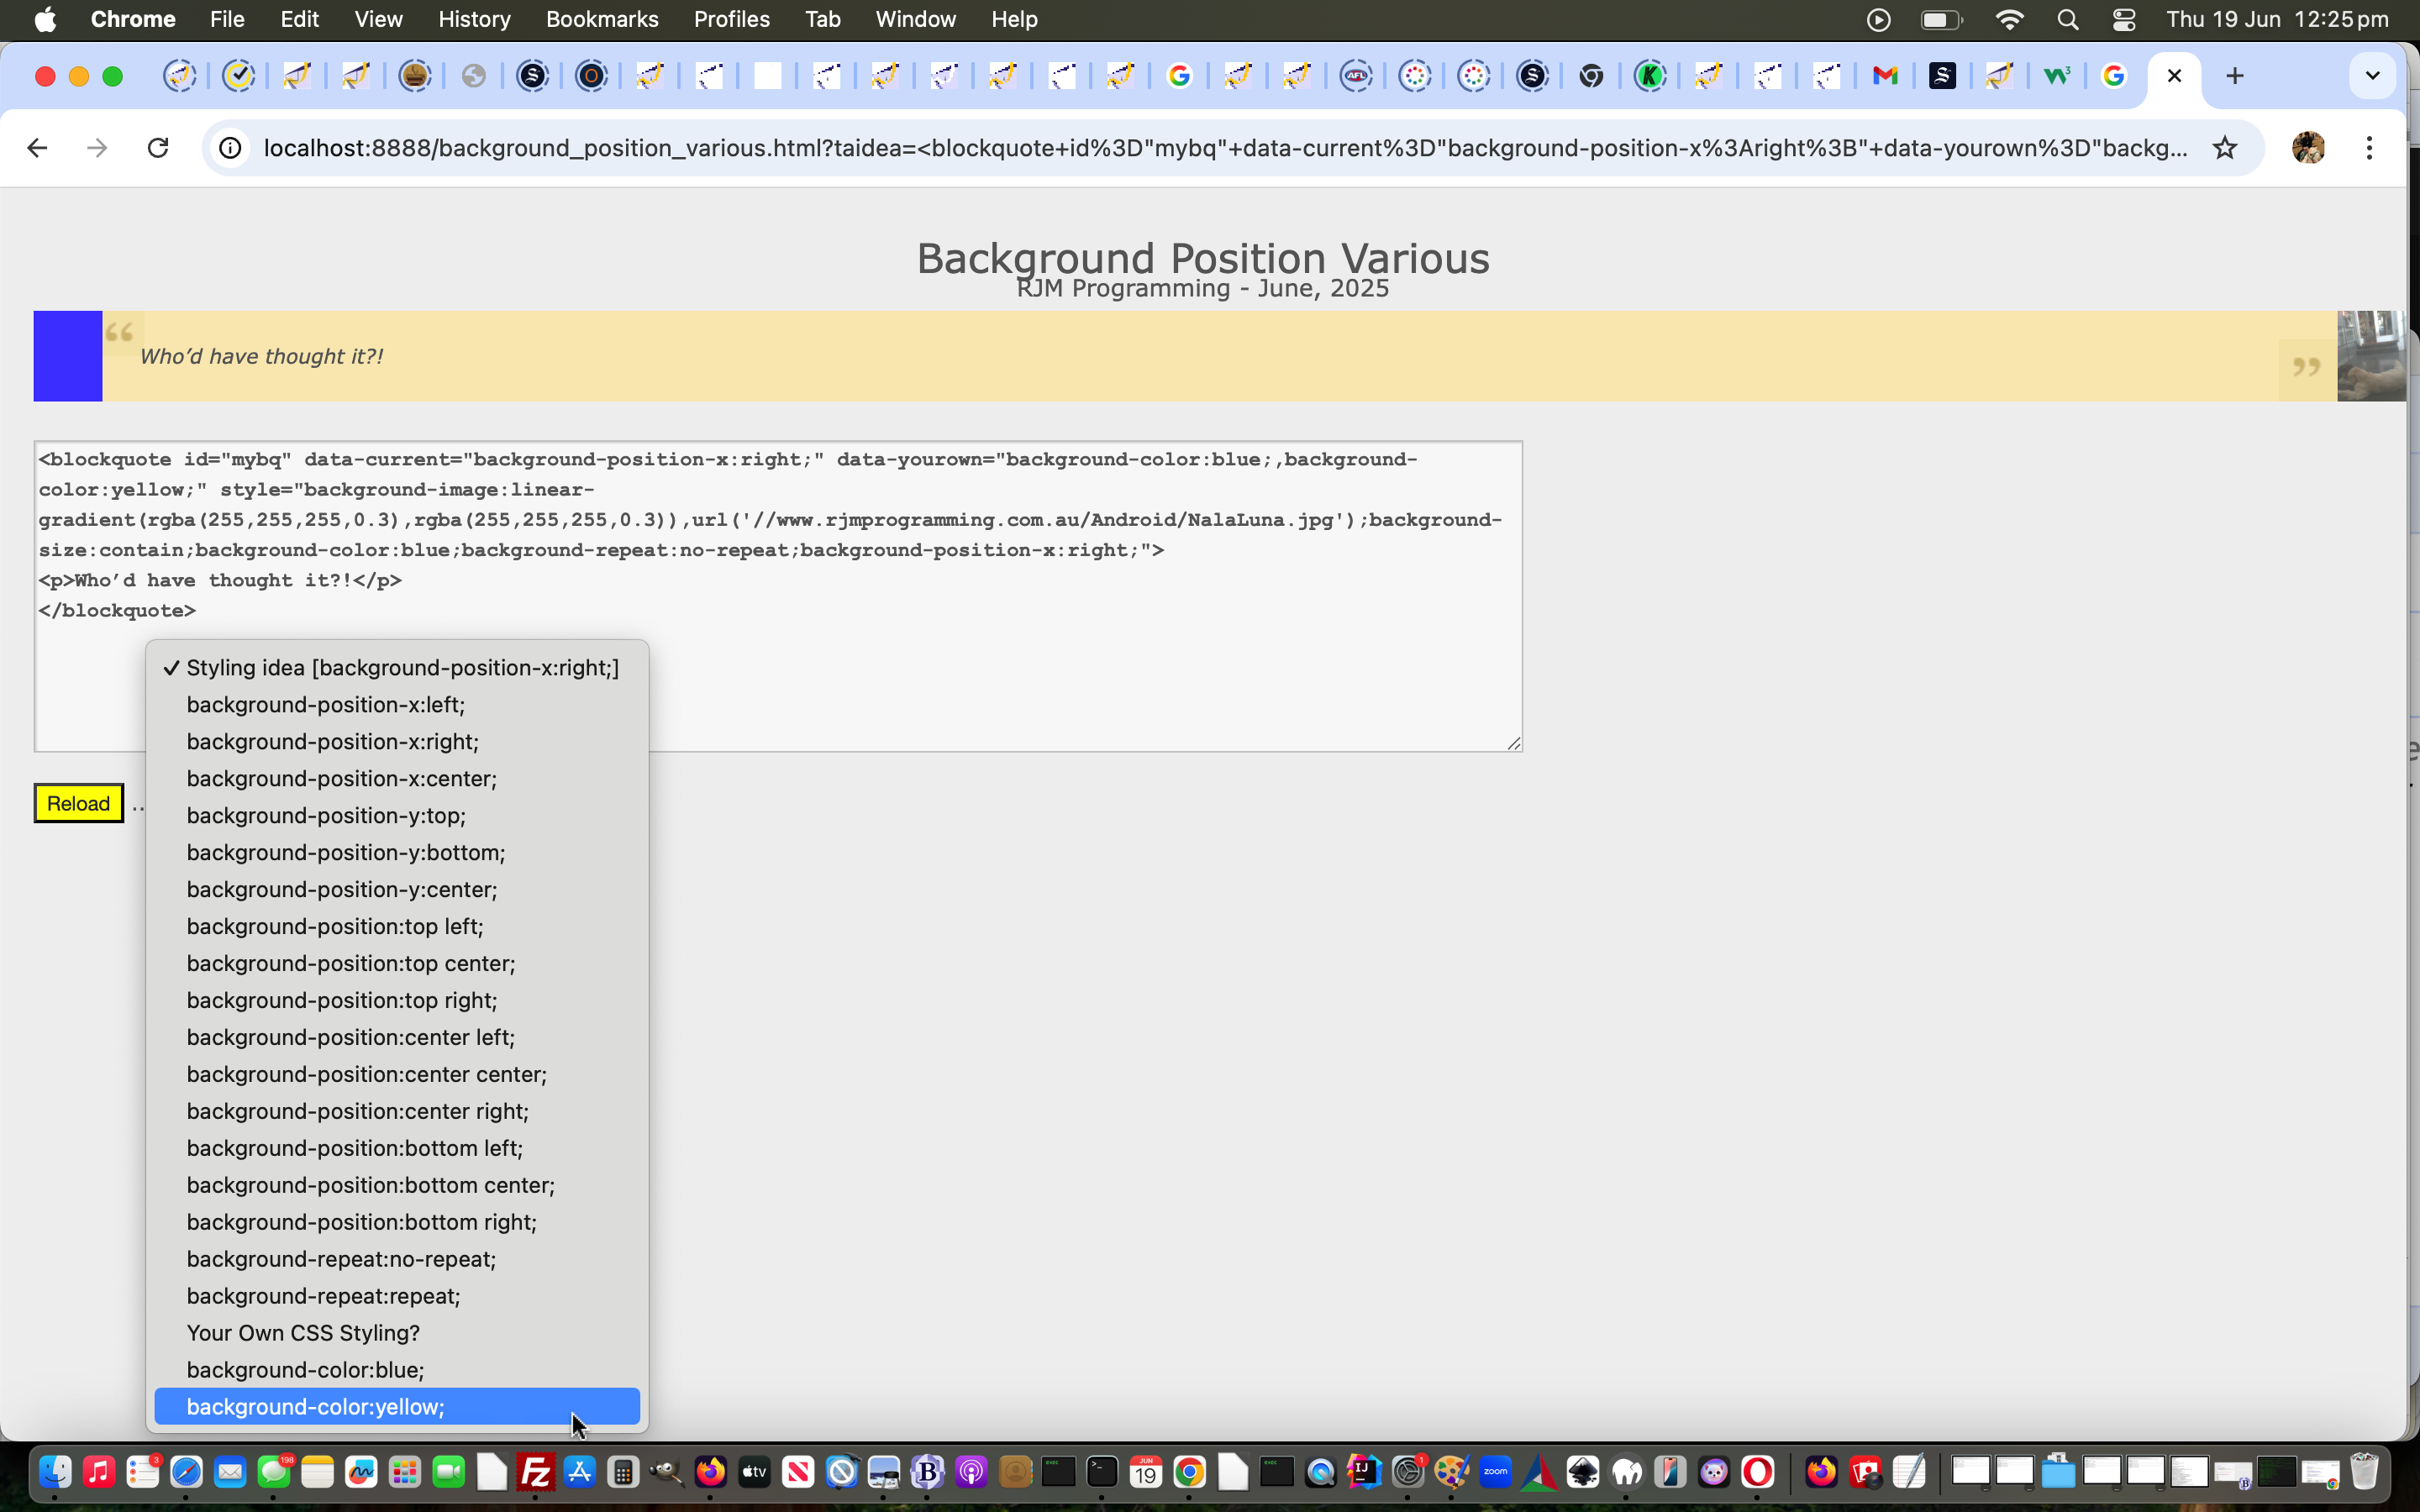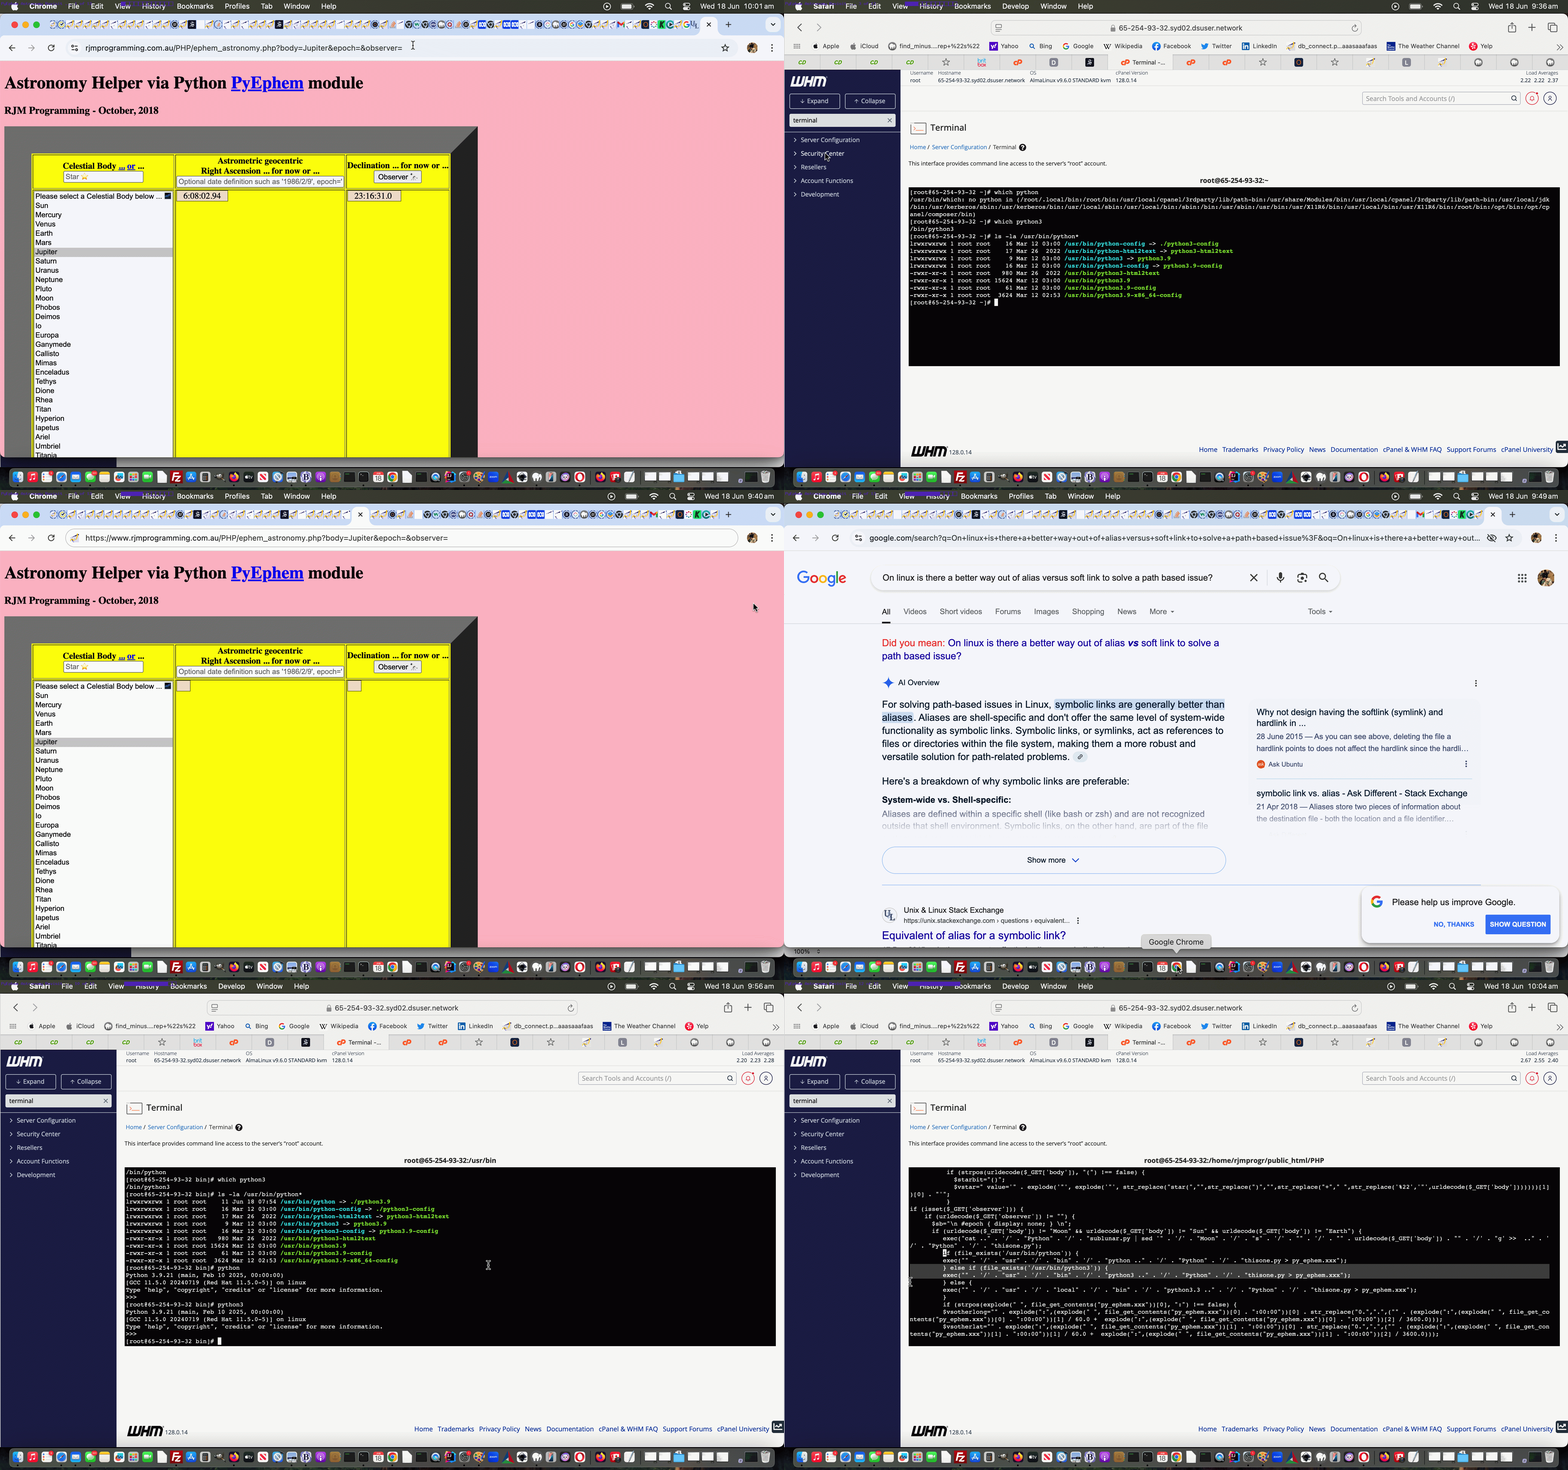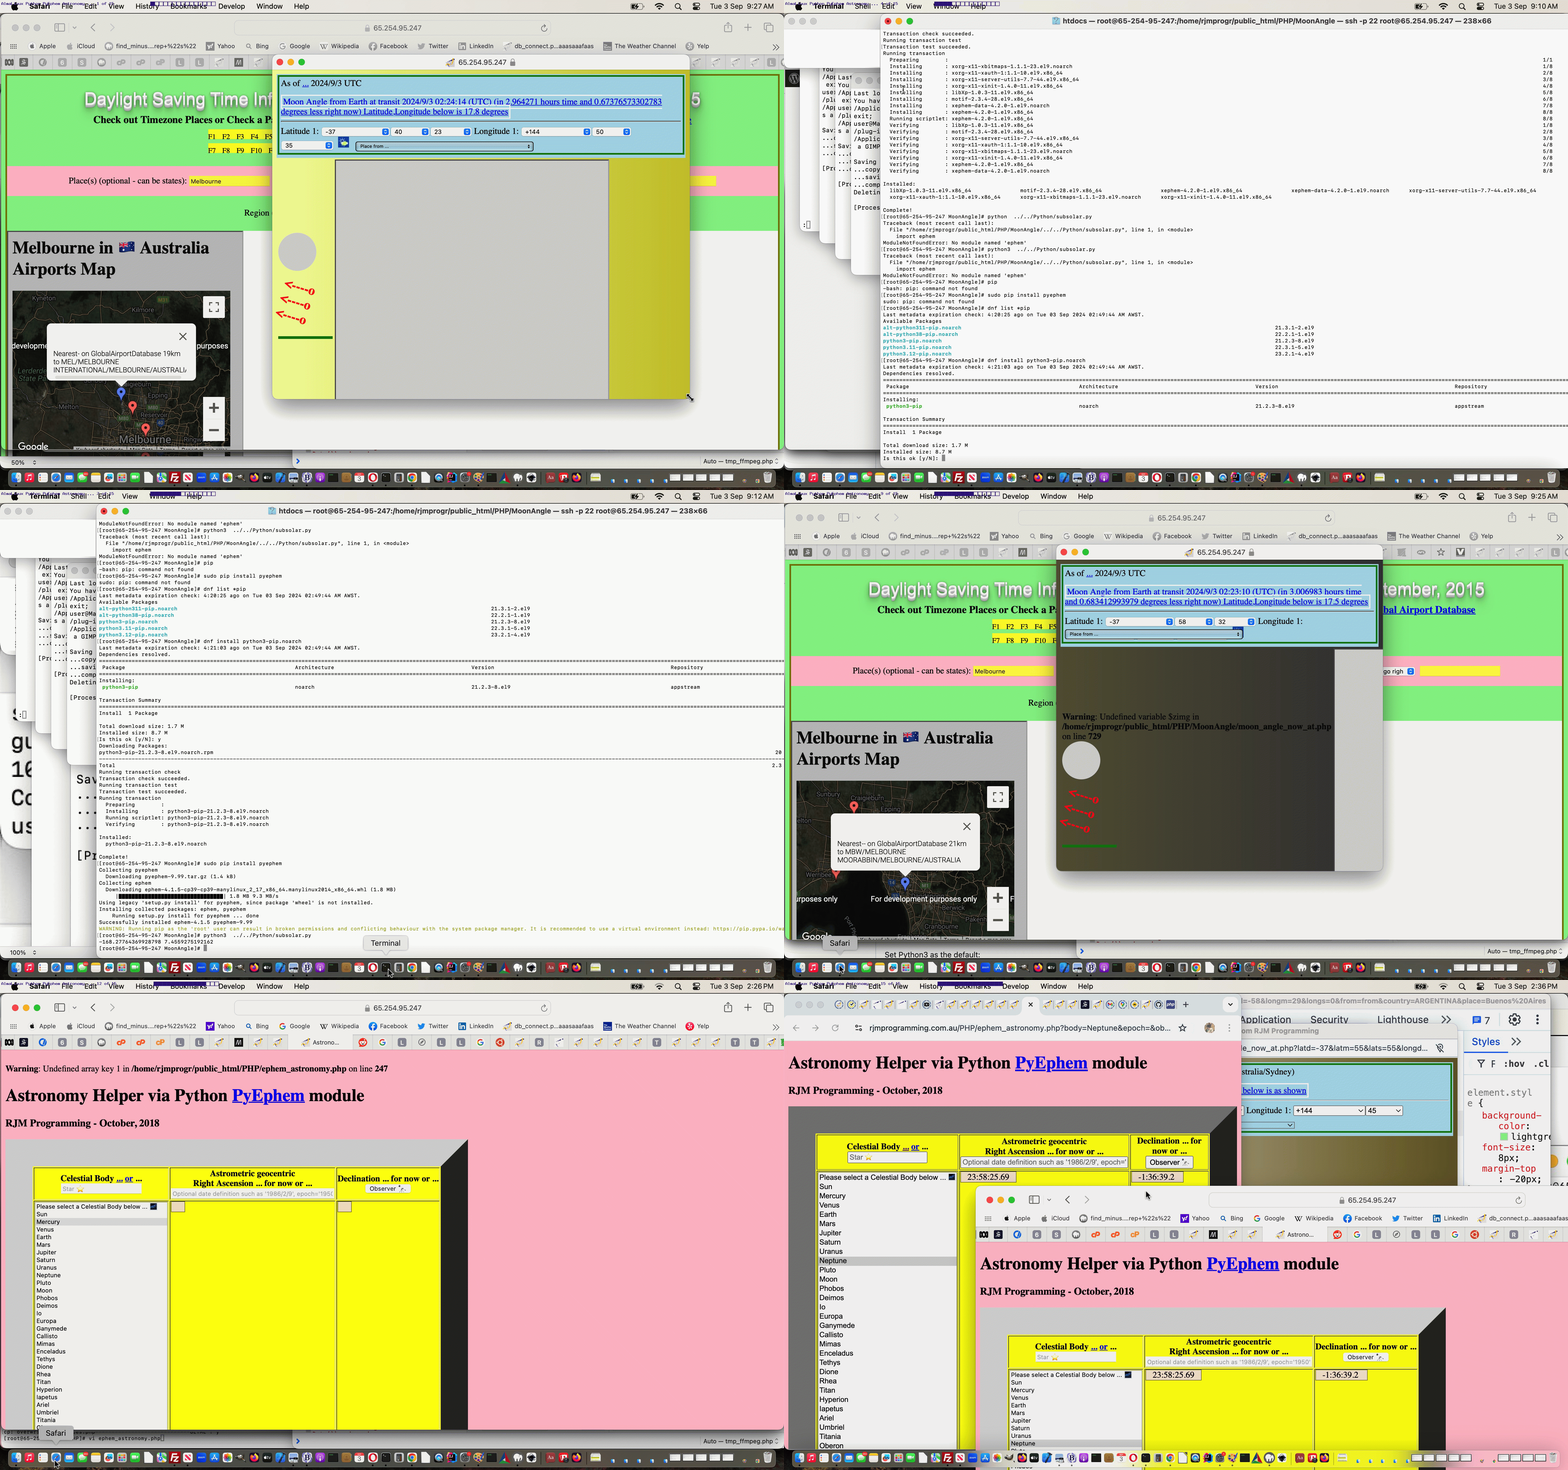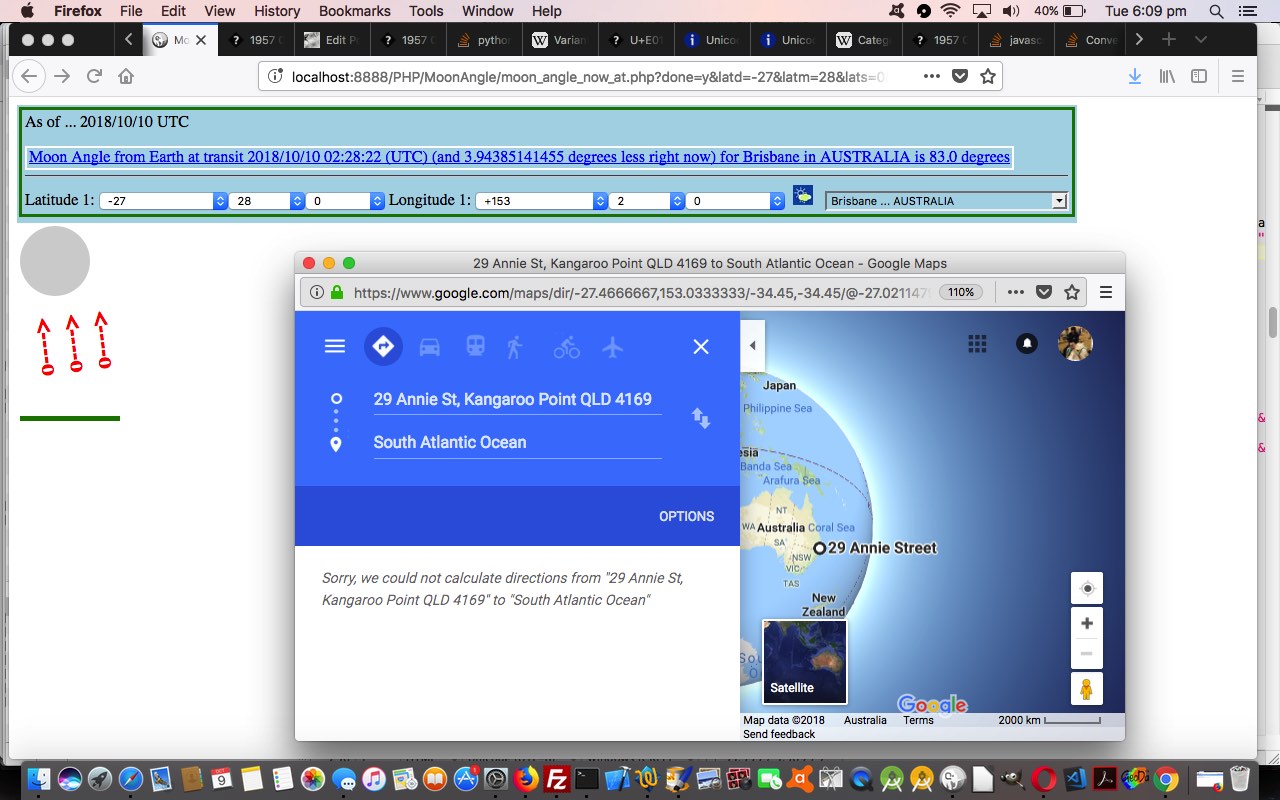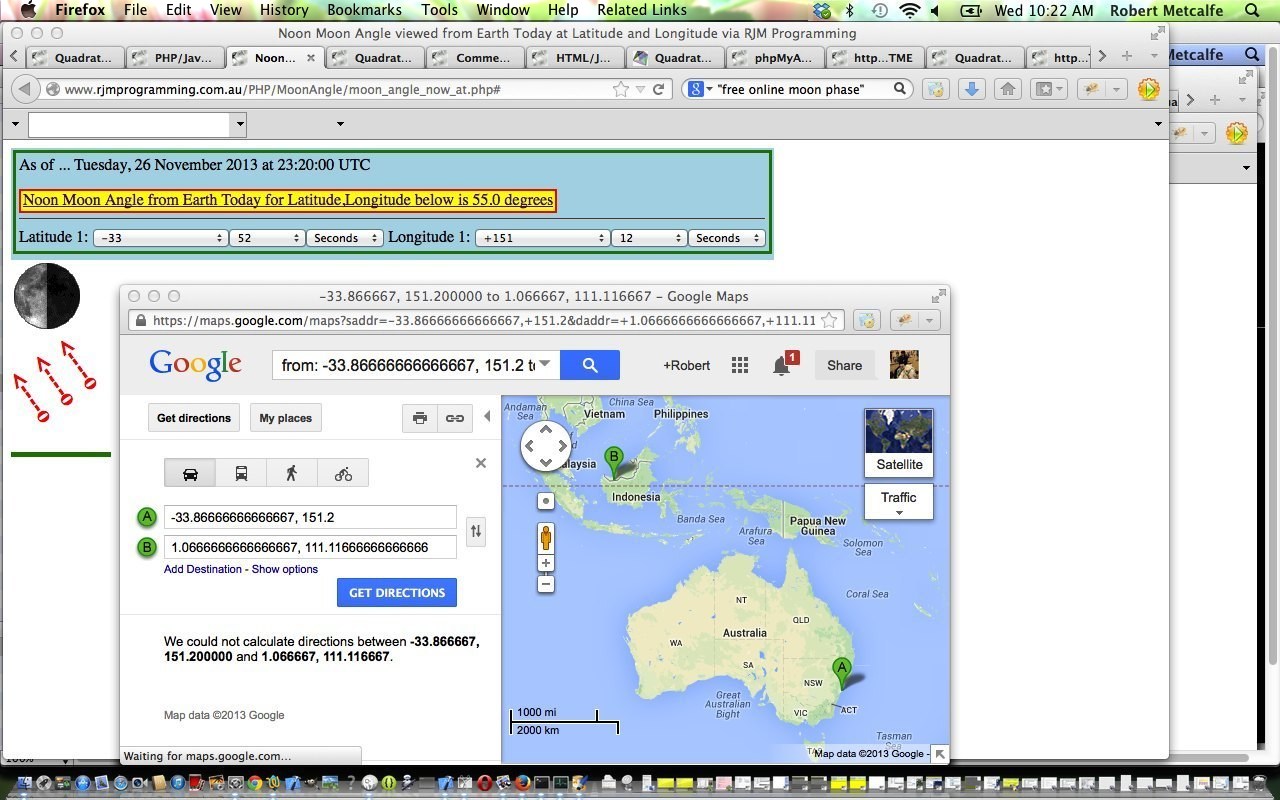
YouTube API SubRip Subtitles Hashtag Tutorial
Yesterday’s YouTube API SubRip Subtitles Primer Tutorial had us allowing for a semi-integrated …
… can move with the times, and understand the nuances of SubRip jive talk, if encouraged?! So …
Yay!!!!!!!!! Team!!!!!!!!!! Give us a K … … …
And didn’t you just know that hashtagging within all the document.URL incarnations would help out here?!
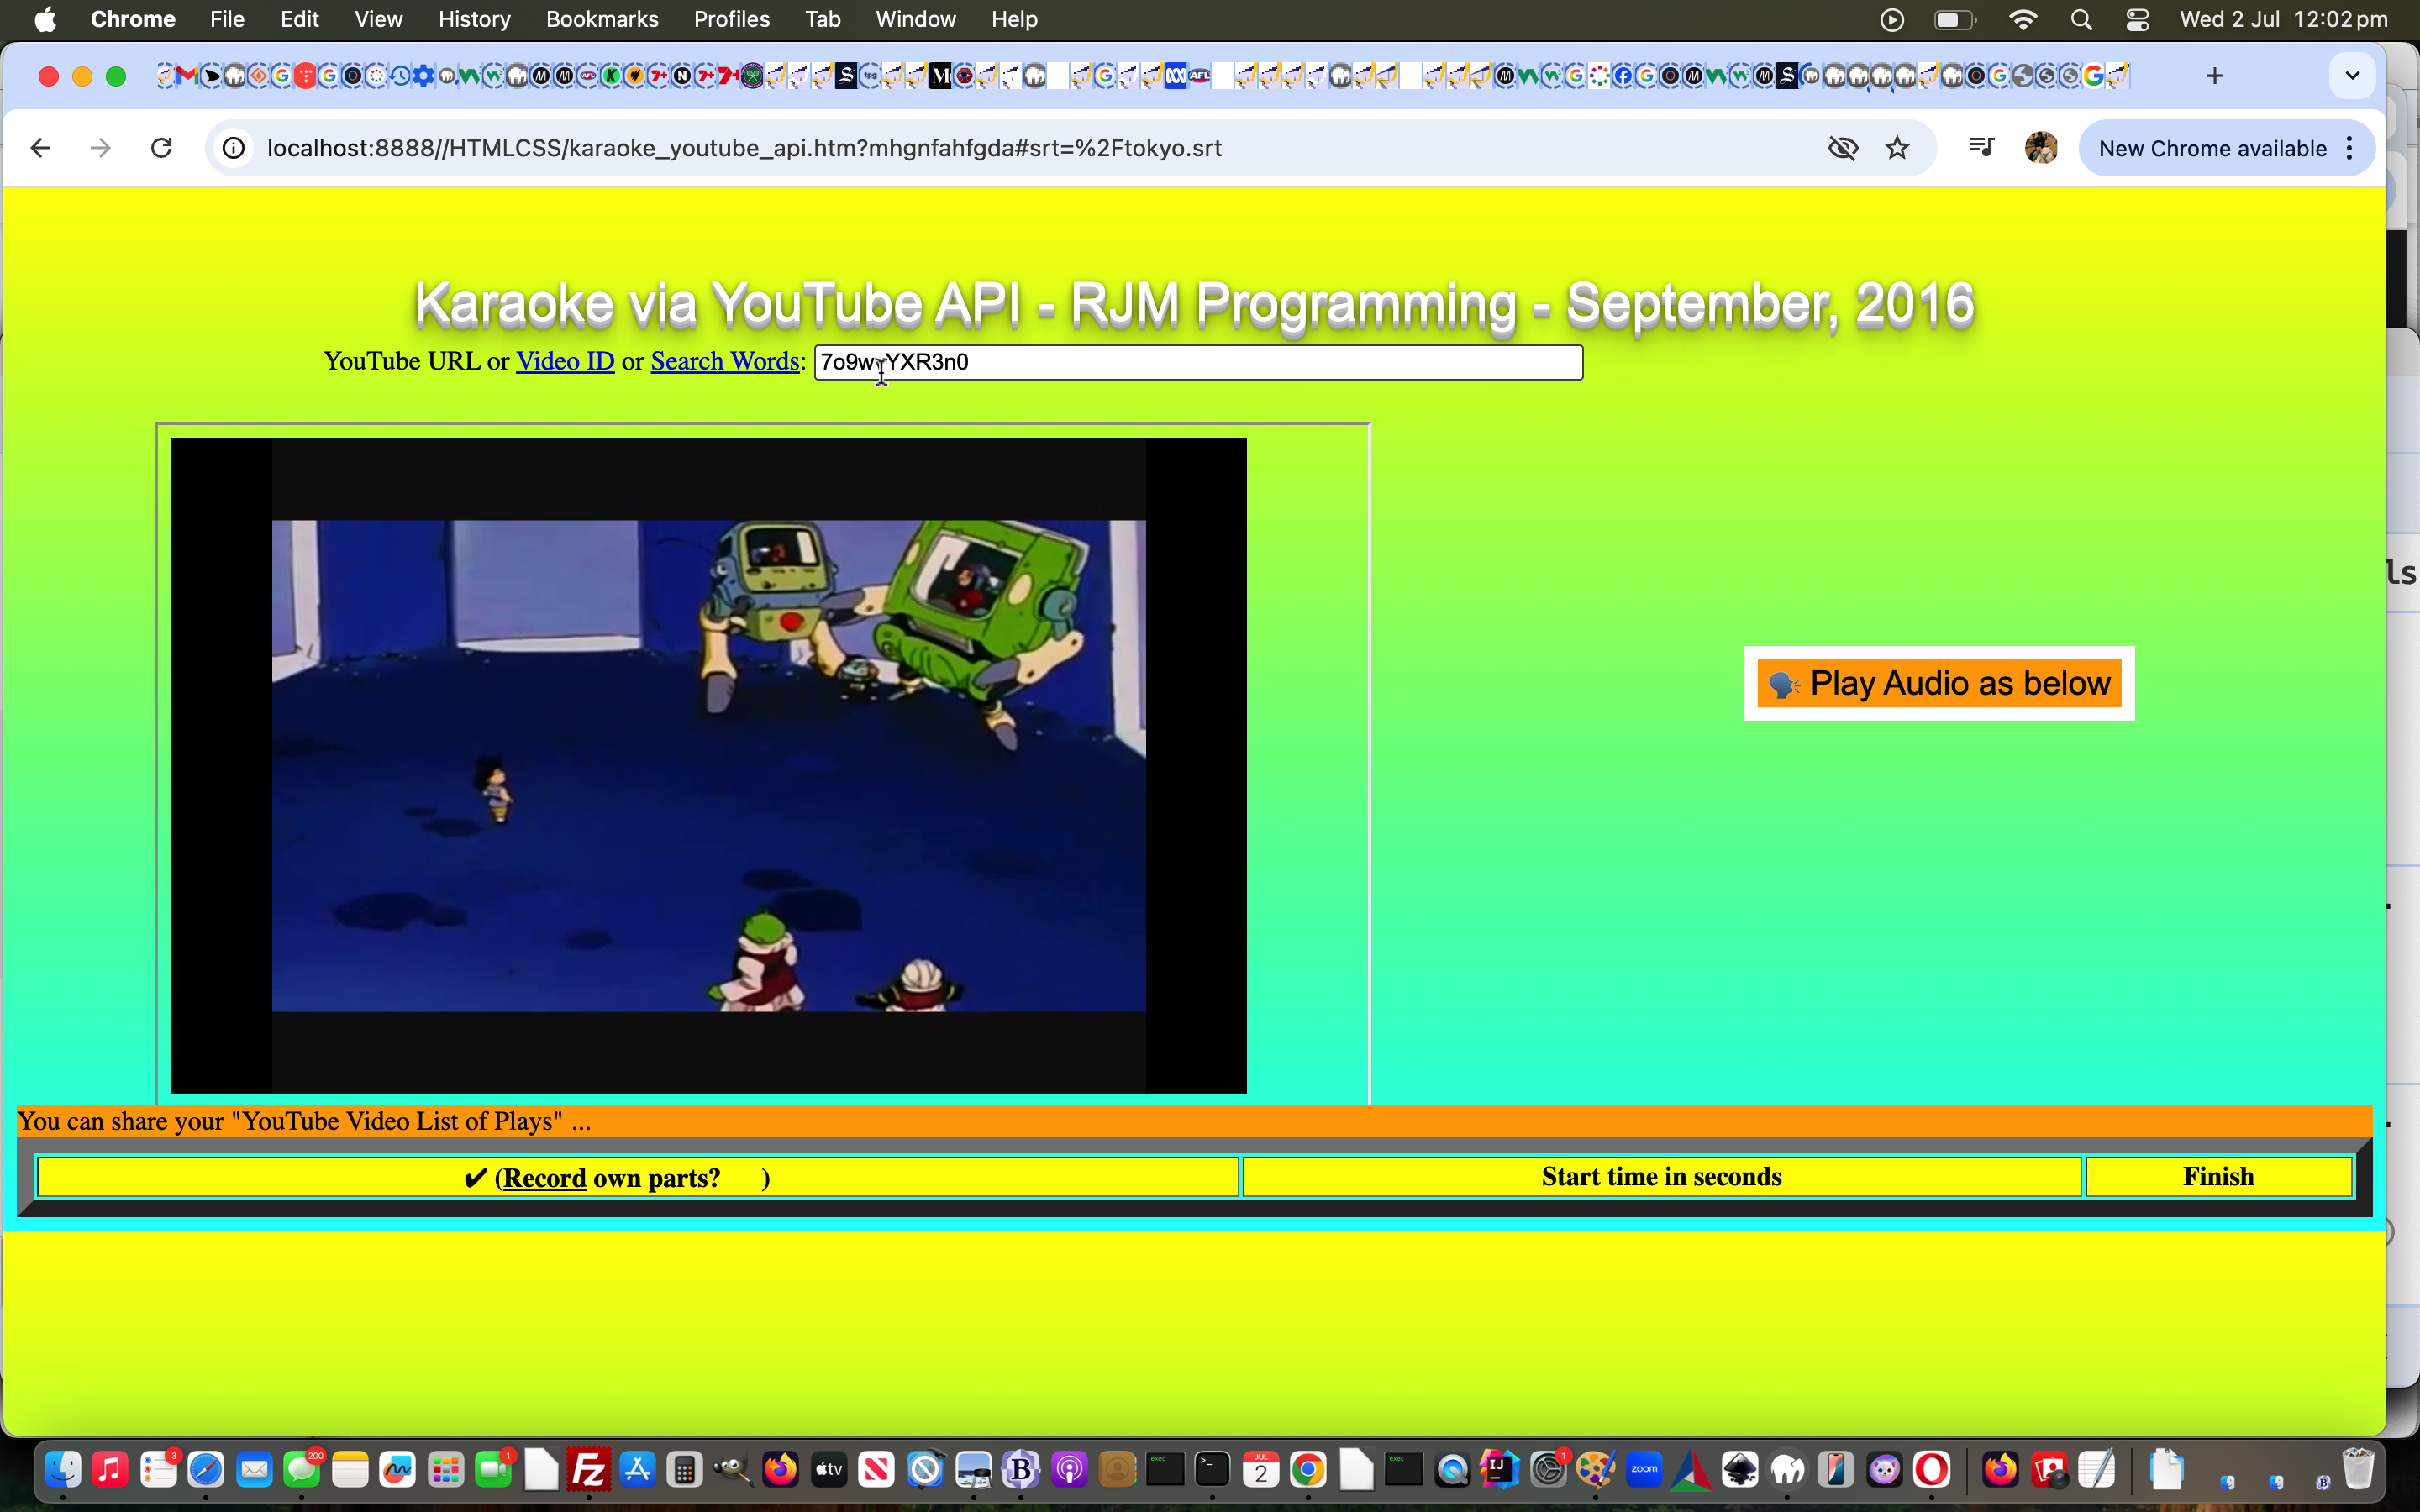
We add the ability at the parent level in that first textbox (that you can reach for yourself by clicking the last link or the tutorial image above) so that an entry like …
7o9wvYXR3n0#/tokyo.srt
… you can simulate here by clicking this link, below, or for a new window incarnation, click here.
Previous relevant YouTube API SubRip Subtitles Primer Tutorial is shown below.
YouTube API SubRip Subtitles Primer Tutorial
We’re back at the YouTube API themes, like with Audio Stream of YouTube Video Play Safari Loading Tutorial, today, allowing for …
SubRip subtitle
… file reading and processing just on the client side, via Ajax methodologies, following up on an idea we had for something “down the track” we hope benefits from the new Javascript below …
var stimes=[], etimes=[], timesubtitles=[], cursubi=-1, xhr=null, cursecselapsed=-1.0, enforcedtimeis=-1.0, isnotplaying=true, createdlh='';

var gsrt=( ('' + location.search + ('' + location.hash).replace(/^undefined/g,'').replace(/^null/g,'')).indexOf('=1' + encodeURIComponent(String.fromCharCode(10))) != -1 ? processsrt('1' + encodeURIComponent(String.fromCharCode(10)) + ('' + location.search + ('' + location.hash).replace(/^undefined/g,'').replace(/^null/g,'')).split('=1' + encodeURIComponent(String.fromCharCode(10))[1].split(encodeURIComponent(String.fromCharCode(10)) + '&')[0].split(encodeURIComponent(String.fromCharCode(10)) + '#')[0])  ).replace(/\+/g, ' ') : (('' + location.search + ('' + location.hash).replace(/^undefined/g,'').replace(/^null/g,'')).toLowerCase().replace(encodeURIComponent('.') + 'vtt',encodeURIComponent('.') + 'srt').indexOf(encodeURIComponent('.') + 'srt') != -1 ? processsrt(('' + location.search + ('' + location.hash).replace(/^undefined/g,'').replace(/^null/g,'')).replace(encodeURIComponent('.') + 'SRT','SRT' + encodeURIComponent('.') + 'srt').replace(encodeURIComponent('.') + 'vtt','vtt' + encodeURIComponent('.') + 'srt').replace(encodeURIComponent('.') + 'VTT','VTT' + encodeURIComponent('.') + 'srt').split(encodeURIComponent('.') + 'srt')[0].split(encodeURIComponent(String.fromCharCode(10)) + '&')[0].split(encodeURIComponent(String.fromCharCode(10)) + '#')[0]) : ''));


 function getlh() {

  return ('' + location.hash).replace(/^undefined/g,'').replace(/^null/g,'');

 }


 function writeoutsubtitle() {

  var newsubi=-1, ithings=0;

  //console.log('call ' + enforcedtimeis + ' ' + cursecselapsed);

  if (enforcedtimeis >= 0.0) {

     cursecselapsed=enforcedtimeis;

  }

  if (cursecselapsed >= 0.0 && cursubi >= 0 && eval('' + etimes.length) > 0 && eval('' + stimes.length) > 0 && eval('' + timesubtitles.length) > 0) {

    if (enforcedtimeis < 0.0) {

     cursecselapsed+=0.1;

    }

    //console.log('' + cursecselapsed);

    if (eval(cursecselapsed) >= eval(stimes[cursubi]) && eval(cursecselapsed) <= eval(etimes[cursubi])) {

    if (document.getElementById('subtitlegoeshere').innerHTML == '' && eval('' + timesubtitles.length) > cursubi) {

      console.log('found for ' + cursubi);

      document.getElementById('subtitlegoeshere').innerHTML=timesubtitles[cursubi];

    }

    } else {

    for (ithings=0; ithings<stimes.length; ithings++) {

      if (eval(cursecselapsed) >= eval(stimes[ithings]) && eval(cursecselapsed) <= eval(etimes[ithings])) {

        newsubi=ithings;

        //alert('yes ' + ithings);

      }

    }

    if (eval(newsubi) >= 0 && eval(cursubi) >= 0 && eval(newsubi) != eval(cursubi)) {

    //alert('' + timesubtitles.length + ' needs to be bigger than ' + newsubi);

    if (eval('' + timesubtitles.length) > eval(newsubi)) {

      cursubi=newsubi;

      console.log('Found for ' + cursubi);

      if (('' + timesubtitles[cursubi]).replace(/^undefined$/g,'').replace('WEBVTT FILE', '') != '') {

      document.getElementById('subtitlegoeshere').innerHTML=('' + timesubtitles[cursubi]).replace(/^undefined$/g,'');

      if (window.parent) {

        if (parent.document.getElementById('subtitlegoeshere')) {

           parent.document.getElementById('subtitlegoeshere').innerHTML=('' + timesubtitles[cursubi]).replace(/^undefined$/g,'');

        }

      }

      }

    }

    } else if (eval(newsubi) >= 0 && eval(cursubi) >= 0 && document.getElementById('subtitlegoeshere').innerHTML == '') {

      console.log('Found For ' + cursubi);

      if (('' + timesubtitles[cursubi]).replace(/^undefined$/g,'').replace('WEBVTT FILE', '') != '') {

      document.getElementById('subtitlegoeshere').innerHTML=('' + timesubtitles[cursubi]).replace(/^undefined$/g,'');

      if (window.parent) {

        if (parent.document.getElementById('subtitlegoeshere')) {

           parent.document.getElementById('subtitlegoeshere').innerHTML=('' + timesubtitles[cursubi]).replace(/^undefined$/g,'');

        }

      }

      }

    }

    }

  }

  if (!isnotplaying) { enforcedtimeis=-1.0;  }

 }


 function convertSrtToText(srt) { // thanks to https://medium.com/@backlinkss.info/convert-srt-to-text-regex-javascript-9660964ee3f0

  // Use a expressão regular para remover os números de linha e as marcas de tempo

  return srt.replace(/^\d+\n([\d:,.]+ --> [\d:,.]+\n)/gm, '');

 }


 function tosecs(fromthistimestamp) {

   var outsecs=0.0, cola=[], cfactor=1.0, icf=0;

   if (fromthistimestamp.replace('.',',').indexOf(',') != -1) {

     outsecs+=eval(eval('' + fromthistimestamp.replace('.',',').split(',')[1]) / Math.pow(10.0, eval('' + fromthistimestamp.replace('.',',').split(',')[1].length)));

     fromthistimestamp=fromthistimestamp.replace('.',',').split(',')[0];

   }

   cola=fromthistimestamp.split(':');

   for (icf=eval(-1 + cola.length); icf>=0; icf--) {

     outsecs+=eval(eval('' + cola[icf]) / cfactor);

     cfactor*=60.0;

   }

   return outsecs;

 }


 function stateChanged() {

  if (xhr.readyState == 4) {

   if (xhr.status == 200) {

    if (xhr.response.indexOf(String.fromCharCode(10)) != -1) {

     gsrt=xhr.response;

     stimes=[];

     etimes=[];

     timesubtitles=[];

     processsrt('');

    }

   }

  }

 }


 function processsrt(instis) {

  var it=0, interimsrt=[];

  if (instis != '') {

    gsrt=decodeURIComponent(instis).replace(/\+/g,' ');

    if (gsrt != '' && gsrt.indexOf(String.fromCharCode(10)) == -1 && gsrt.indexOf('=') != -1) {

      gsrt=gsrt.split('=')[eval(-1 + gsrt.split('=').length)] + '.srt';

    }

    if (gsrt.toLowerCase().trim() != gsrt.toLowerCase().trim().replace(/\.srt$/g,'')) {

     xhr = new XMLHttpRequest();

     xhr.onreadystatechange=stateChanged;

     createdlh='#srt=' + encodeURIComponent(gsrt.replace(/SRT\.srt$/g, '.SRT'));

     xhr.open('get',gsrt.replace(/SRT\.srt$/g, '.SRT').replace(/VTT\.srt$/g, '.VTT').replace(/vtt\.srt$/g, '.vtt'),true);

     xhr.send(null);

    }

    gsrt='';

    return decodeURIComponent(instis).replace(/SRT\.srt$/g, '.SRT').replace(/VTT\.srt$/g, '.VTT').replace(/vtt\.srt$/g, '.vtt');

  }

  if (gsrt != '') {

    interimsrt=gsrt.split(' --> ');

    timesubtitles=convertSrtToText(gsrt).split(String.fromCharCode(10) + String.fromCharCode(10));

    // 1\n00:00:10,500 --> 00:00:13,000\nhuh\n\n2\n00:00:13,000 --> 00:00:23,000\nhuhagain

    stimes.push(0.0);

    etimes.push(0.0);

    for (it=1; it<interimsrt.length; it++) {

      stimes.push(tosecs(interimsrt[eval(-1 + it)].split(String.fromCharCode(10))[eval(-1 + interimsrt[eval(-1 + it)].split(String.fromCharCode(10)).length)]));

      etimes.push(tosecs(interimsrt[eval(0 + it)].split(String.fromCharCode(10))[0]));

    }

  //alert('' + stimes.length + '/' + etimes.length + '/' + timesubtitles.length);

    if (eval('' + etimes.length) > 0) {

      cursubi=0;

      setInterval(writeoutsubtitle, 100);

    }

  }

  if (createdlh == '') {

     createdlh='#srt=' + encodeURIComponent(decodeURIComponent(instis).replace(/\+/g,' '));

  }

  //alert('' + stimes.length + '/' + etimes.length + '/' + timesubtitles.length);

  //console.log(stimes);

  //console.log(etimes);

  //console.log(timesubtitles);

  return decodeURIComponent(instis);

 }
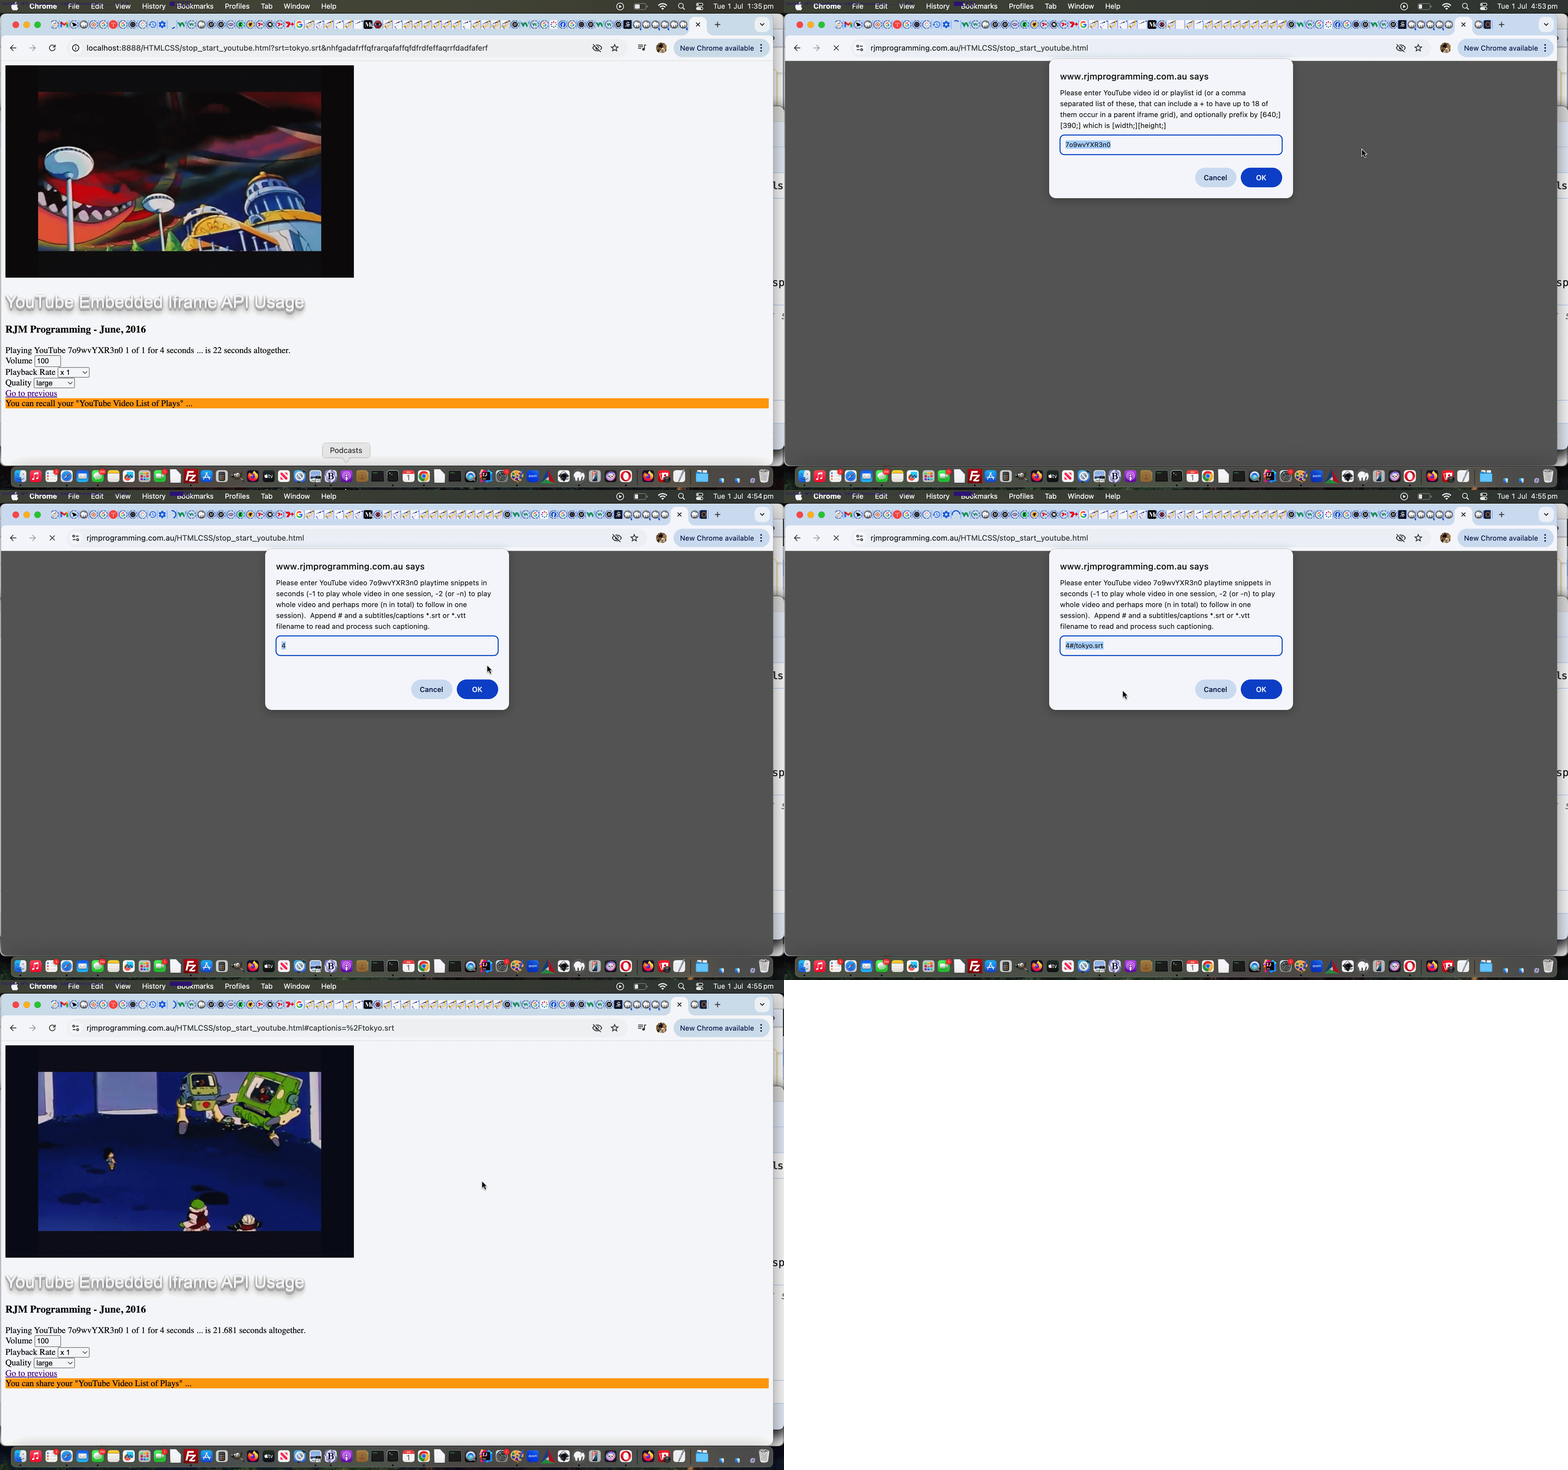
Today’s “primer” tutorial hones in on the grandchild level inhouse YouTube API interfacing HTML and Javascript we have going, and testing on it’s “standalone” incarnation, if you will, in the reworked stop_start_youtube.html inhouse YouTube API interfacer code.
Previous relevant Audio Stream of YouTube Video Play Safari Loading Tutorial is shown below.

Audio Stream of YouTube Video Play Safari Loading Tutorial
Regarding the day before yesterday’s Audio Stream of YouTube Video Play Safari Title Tutorial‘s “first day” approach of timing as a concern when WordPress blog postings contain links to Audio Stream of YouTube Video Play inhouse functionality, we’re returning to that theme, from a different place.
A pinch point with web applications needing memory resources are …
- document.body onload event (itself, or around the same time) … as well as any …
- iframe onload events within that document.body innerHTML “innards”
We think at the document.body onload event (itself, or around the same time), if there are more than one “a” link class=ytaudioonly involved, the modus operandi difference between …
- non-mobile “a” link emoji addition … versus …
- mobile “a” link transforms into an iframe element involving considerable resources
… is better arranged so that for mobile platforms, the creation of those iframe elements is spaced out in time.
And this was pretty simple to do in the relevant external Javascript …
  var slow_approach=false;

  if (navigator.userAgent.match(/Android|BlackBerry|iPhone|iPad|iPod|Opera Mini|IEMobile/i)) {

    slow_approach=true;

  }


  function audioytlook() {  // first happens around document.body onload event

    var isSafari = /Safari/.test(navigator.userAgent) && /Apple Computer/.test(navigator.vendor);

    if ('safari_iphone_repeatedly-issue' != 'safari_iphone_repeatedly-issue') { // now handled with stop_start_youtube.html via document.title reappraisal

    if (navigator.userAgent.match(/iPhone/i) && oktocheck && isSafari) {

     if (('' + top.document.URL).indexOf('/external-javascript-') != -1 && ('' + top.document.URL).indexOf('andabit=') != -1) {

     if (document.URL.indexOf('/karaoke_') == -1) {

      oktocheck=false;

      setTimeout(audioytlook, 180000);

      return '';

     }

     } else if (('' + top.document.URL).indexOf('/external-javascript-') != -1) {

     if (document.URL.indexOf('/karaoke_') == -1) {

      oktocheck=false;

      setTimeout(audioytlook, 180000);

      return '';

     }

     }

    }

    }

    oktocheck=false;

    var onefound=false;

    var delts=['s','m','h','d'], deltv=[1,60,3600,196000], idel=0;

    var spos='0', sposspare='', altend='22223';

    var audioemoji='<sup data-status="" style="z-index:599;" data-ontouchstart="event.stopPropagation(); onsupclick(event);" data-onclick="event.stopPropagation(); onsupclick(event);" title="Right click opens in new window the video and audio but normal click just plays audio in place.  Numerical only entry in textarea seeks that audio timing position.  Numerical space search text does YouTube search of search text to create the numerical number of audio only YouTube video links.  Eg. 7 octopus anatomy"> ' + String.fromCodePoint(128251) + String.fromCodePoint(127926) + '</sup>';

    //audioemoji='<sup> ' + String.fromCodePoint(128251) + String.fromCodePoint(127926) + '</sup>';

    //audioemoji='';

    var suffixin='', suffixout='';

    var onoroff='on';

    var ipd=0, foundne=false, sscidea='';

    var audioonlyas=document.getElementsByTagName('a');

    if (!navigator.userAgent.match(/Android|BlackBerry|iPhone|iPad|iPod|Opera Mini|IEMobile/i)) {

      audioemoji='<sup data-status="" style="z-index:599;" data-ontouchstart="event.stopPropagation(); onsupclick(event);" data-onclick="event.stopPropagation(); onsupclick(event);" title="Right click opens in new window the video and audio but normal click just plays audio in place.  Numerical only entry in textarea seeks that audio timing position.  Numerical space search text does YouTube search of search text to create the numerical number of audio only YouTube video links.  Eg. 7 octopus anatomy"> ' + String.fromCodePoint(128251) + String.fromCodePoint(127926) + '</sup>';

    }

    for (var iuhg=eval(-1 + eval('' + audioonlyas.length)); iuhg>=0; iuhg--) {  //for (var iuhg=0; iuhg<audioonlyas.length; iuhg++) {

       if (('' + audioonlyas[iuhg].className) == 'audioytplay' && ('' + audioonlyas[iuhg].outerHTML).indexOf(' data-processed=') == -1) {

  if (document.URL.indexOf('/karYOULLNEVERFINDTHISaoke_') != -1) {

  alert(23);

  }

         if (('' + audioonlyas[iuhg].outerHTML).split('>')[0].indexOf('HTMLCSS/karaoke_youtube_api.htm') == -1 && ('' + audioonlyas[iuhg].outerHTML).split('>')[0].indexOf('youtube.com/watch?v=') != -1) {

  if (document.URL.indexOf('/karYOULLNEVERFINDTHISaoke_') != -1) {

  alert(223);

  }


  // https://www.rjmprogramming.com.au/HTMLCSS/karaoke_youtube_api.htm?youtubeid=kUI_P5eMVLo&youtube_duration=202.181&email=&email=&emoji=on&c0=on&i0=14&j0=22.181&i1=&j1=&i2=&j2=&i3=&j3=&i4=&j4=&i5=&j5=&i6=&j6=&i7=&j7=&i8=&j8=&i9=&j9=&i10=&j10=&i11=&j11=&i12=&j12=&i13=&j13=&i14=&j14=&i15=&j15=&i16=&j16=&i17=&j17=&i18=&j18=&i19=&j19=&i20=&j20=&i21=&j21=&i22=&j22=&i23=&j23=&i24=&j24=&i25=&j25=&i26=&j26=&i27=&j27=&i28=&j28=&i29=&j29=

           altend='22223';

           spos='0';

           //if (('' + audioonlyas[iuhg].innerHTML) == 'again') {

  //alert('x:' + audioonlyas[iuhg].outerHTML);

           //}

           if (('' + audioonlyas[iuhg].href).split('>')[0].split('youtube.com/watch?v=')[1].replace('#t','&t').indexOf('&t=') != -1) { // &t=2m37s

             sposspare=('' + audioonlyas[iuhg].href).split('>')[0].split('youtube.com/watch?v=')[1].replace('#t','&t').split('&t=')[1].split('&')[0].split('#')[0].split('"')[0].split("'")[0].split('>')[0];

             if (sposspare.indexOf(':') != -1) {

               for (idel=eval(-1 + sposspare.split(':').length); idel>=0; idel--) {

                 spos='' + eval(eval('' + spos) + eval(deltv[idel] * eval('' + sposspare.split(':')[idel]  )));

               }

             } else {

  //alert(sposspare);

               for (idel=3; idel>=0; idel--) {

                if (sposspare.indexOf(delts[idel]) != -1) {

                 spos='' + eval(eval('' + spos) + eval(deltv[idel] * eval('' + sposspare.split(delts[idel])[0].slice(-3).replace(delts[0],'').replace(delts[1],'').replace(delts[2],'').replace(delts[3],'')  )));

                } else if (idel == 3 && sposspare.indexOf(delts[2]) == -1 && sposspare.indexOf(delts[1]) == -1 && sposspare.indexOf(delts[0]) == -1) {

                 spos='' + sposspare;

                }

               }

             }

           }

           if (('' + audioonlyas[iuhg].href).split('>')[0].split('youtube.com/watch?v=')[1].indexOf('#e=') != -1) { // &t=2m37s

             sposspare=('' + audioonlyas[iuhg].href).split('>')[0].split('youtube.com/watch?v=')[1].split('#e=')[1].split('&')[0].split('#')[0].split('"')[0].split("'")[0].split('>')[0];

             if (sposspare.indexOf(':') != -1) {

               altend='0.000';

               for (idel=eval(-1 + sposspare.split(':').length); idel>=0; idel--) {

                 altend='' + eval(eval('' + altend) + eval(deltv[idel] * eval('' + sposspare.split(':')[idel]  )));

               }

             } else {

               altend='0.000';

               for (idel=3; idel>=0; idel--) {

                if (sposspare.indexOf(delts[idel]) != -1) {

                 altend='' + eval(eval('' + altend) + eval(deltv[idel] * eval('' + sposspare.split(delts[idel])[0].slice(-3).replace(delts[0],'').replace(delts[1],'').replace(delts[2],'').replace(delts[3],'')  )));

                } else if (idel == 3 && sposspare.indexOf(delts[2]) == -1 && sposspare.indexOf(delts[1]) == -1 && sposspare.indexOf(delts[0]) == -1) {

                 altend='' + eval(eval('' + altend) + eval('' + sposspare));

                }

               }

             }

           }

           if (('' + audioonlyas[iuhg].href).split('>')[0].split('youtube.com/watch?v=')[1].indexOf('#d') != -1) { // &t=2m37s

           if (('' + audioonlyas[iuhg].href).split('>')[0].split('youtube.com/watch?v=')[1].split('#d')[1].indexOf('=') != -1) { // &t=2m37s

             sposspare=('' + audioonlyas[iuhg].href).split('>')[0].split('youtube.com/watch?v=')[1].split('#d')[1].split('=')[1].split('&')[0].split('#')[0].split('"')[0].split("'")[0].split('>')[0];

             if (sposspare.indexOf(':') != -1) {

               altend=spos.split('.')[0] + '.000';

               for (idel=eval(-1 + sposspare.split(':').length); idel>=0; idel--) {

                 altend='' + eval(eval('' + altend) + eval(deltv[idel] * eval('' + sposspare.split(':')[idel]  )));

               }

             } else {

               altend=spos.split('.')[0] + '.000';

               for (idel=3; idel>=0; idel--) {

                if (sposspare.indexOf(delts[idel]) != -1) {

                 altend='' + eval(eval('' + altend) + eval(deltv[idel] * eval('' + sposspare.split(delts[idel])[0].slice(-3).replace(delts[0],'').replace(delts[1],'').replace(delts[2],'').replace(delts[3],'')  )));

                } else if (idel == 3 && sposspare.indexOf(delts[2]) == -1 && sposspare.indexOf(delts[1]) == -1 && sposspare.indexOf(delts[0]) == -1) {

                 altend='' + eval(eval('' + altend) + eval('' + sposspare));

                }

               }

             }

           }

           }

           theytcode=('' + audioonlyas[iuhg].outerHTML).split('>')[0].split('youtube.com/watch?v=')[1].split('&')[0].split('#')[0].split('"')[0].split('>')[0];

           thisaudiooh=audioonlyas[iuhg].outerHTML;

           thisaudioih=audioonlyas[iuhg].innerHTML;

           thisaudioit=audioonlyas[iuhg].innerText;

           //alert(thisaudioih);

           suffixin='';

           suffixout='';

           foundne=false;

           dbidea=document.body;

           thisaudiotitle=('' + audioonlyas[iuhg].title).trim();

           if (('' + audioonlyas[iuhg].target + '_').substring(0,1) == '_') {

             while (document.getElementById(newaudioifid)) {

               newaudioifid+='x';

             }

             if (('' + audioonlyas[iuhg].outerHTML).split('>')[0].indexOf(' id=') != -1) {

               newaudioaid='' + audioonlyas[iuhg].id;

             } else {

              while (document.getElementById(newaudioaid)) {

               newaudioaid+='x';

              }

             }

           }

           if (!foundne) {

             if (eval('' + thespansare.length) == 0) {

               thespansare=document.getElementsByTagName('span');

             }

             for (ipd=eval(-1 + eval('' + thespansare.length)); ipd>=0; ipd--) {

               if (!foundne && thespansare[ipd].innerHTML.indexOf(audioonlyas[iuhg].outerHTML) != -1) {

                 dbidea=thespansare[ipd];

                 foundne=true;

           thisaudiooh=audioonlyas[iuhg].outerHTML;

           thisaudioih=audioonlyas[iuhg].innerHTML;

           thisaudioit=audioonlyas[iuhg].innerText;

           //if (navigator.userAgent.match(/Android|BlackBerry|iPhone|iPad|iPod|Opera Mini|IEMobile/i)) {

  if (document.URL.indexOf('/karYOULLNEVERFINDTHISaoke_') != -1) {

           alert('3:' + dbidea.outerHTML + ' vs ' + thisaudiooh);

  }

           //}

               }

             }

           }

           if (!foundne) {

             if (eval('' + thepsare.length) == 0) {

               thepsare=document.getElementsByTagName('p');

             }

             for (ipd=eval(-1 + eval('' + thepsare.length)); ipd>=0; ipd--) {

               if (!foundne && thepsare[ipd].innerHTML.indexOf(audioonlyas[iuhg].outerHTML) != -1) {

                 dbidea=thepsare[ipd];

                 foundne=true;

           thisaudiooh=audioonlyas[iuhg].outerHTML;

           thisaudioih=audioonlyas[iuhg].innerHTML;

           thisaudioit=audioonlyas[iuhg].innerText;

           //if (navigator.userAgent.match(/Android|BlackBerry|iPhone|iPad|iPod|Opera Mini|IEMobile/i)) {

             if (document.URL.indexOf('/karYOULLNEVERFINDTHISaoke_') != -1) {

           alert('1:' + dbidea.outerHTML + ' vs ' + thisaudiooh);

             }

           //}

               }

             }

           }

           if (!foundne) {

             if (eval('' + thedivsare.length) == 0) {

               thedivsare=document.getElementsByTagName('div');

             }

             for (ipd=eval(-1 + eval('' + thedivsare.length)); ipd>=0; ipd--) {

               if (!foundne && thedivsare[ipd].innerHTML.indexOf(audioonlyas[iuhg].outerHTML) != -1) {

                 dbidea=thedivsare[ipd];

                 foundne=true;

           thisaudiooh=audioonlyas[iuhg].outerHTML;

           thisaudioih=audioonlyas[iuhg].innerHTML;

           thisaudioit=audioonlyas[iuhg].innerText;

           //if (navigator.userAgent.match(/Android|BlackBerry|iPhone|iPad|iPod|Opera Mini|IEMobile/i)) {

             if (document.URL.indexOf('/karYOULLNEVERFINDTHISaoke_') != -1) {

           alert('2:' + dbidea.outerHTML + ' vs ' + thisaudiooh);

             }

           //}

               }

             }

           }

  if (document.URL.indexOf('/karYOULLNEVERFINDTHISaoke_') != -1) {

  alert(1123);

  }

           curdbih='' + dbidea.innerHTML;

           thisaudiooh=audioonlyas[iuhg].outerHTML;

           thisaudioih=audioonlyas[iuhg].innerHTML;

           thisaudioit=audioonlyas[iuhg].innerText;

           if (curdbih.indexOf(thisaudiooh) != -1) {

             if ((curdbih + '<').split(thisaudiooh)[1].substring(0,1) != '<') {

                suffixin=(curdbih + '').split(thisaudiooh)[1].split('<')[0];

                if (suffixin.replace(String.fromCharCode(10),'').replace(String.fromCharCode(10),'').trim() != '') {

                  suffixout='<span>' + suffixin.replace(String.fromCharCode(10),'').replace(String.fromCharCode(10),'') + '</span>';

                } else {

                  suffixin='';

                }

             }

             suffixin='';

             suffixout='';

  if (document.URL.indexOf('/karYOULLNEVERFINDTHISaoke_') != -1) {

   alert('dbidea.outerHTML=' + dbidea.outerHTML);

   alert('41123 ' + audioonlyas[iuhg].getBoundingClientRect().height + ' ' + audioonlyas[iuhg].getBoundingClientRect().width);

   alert("<a class=processytplay id=\"" + newaudioaid + "\" target=\"_blank\" title=\"" + thisaudiotitle + "\" onmouseover=\"if (!navigator.userAgent.match(/Android|BlackBerry|iPhone|iPad|iPod|Opera Mini|IEMobile/i)) {  this.title+=' ';  this.target='" + newaudioifid + "'; } \" onclick=\"if (!navigator.userAgent.match(/Android|BlackBerry|iPhone|iPad|iPod|Opera Mini|IEMobile/i) && this.title == this.title.trim()) {  this.title+=' ';  this.target='" + newaudioifid + "';  document.getElementById('" + newaudioifid + "').src=this.href; } setTimeout(function(){ document.getElementById('" + newaudioaid + "').target='_blank'; },100);\" href=\"//www.rjmprogramming.com.au/HTMLCSS/karaoke_youtube_api.htm?youtubeid=" + theytcode + "&theaid=" + newaudioaid + "&theiframeid=" + newaudioifid + "&thebuttonwording=" + encodeURIComponent(thisaudioit) + "&justaJUNKudio=&youtube_duration=22223.000&email=&emoji=on&c0=on&i0=" + spos + "&j0=" + altend + "&i1=&j1=&i2=&j2=&i3=&j3=&i4=&j4=&i5=&j5=&i6=&j6=&i7=&j7=&i8=&j8=&i9=&j9=&i10=&j10=&i11=&j11=&i12=&j12=&i13=&j13=&i14=&j14=&i15=&j15=&i16=&j16=&i17=&j17=&i18=&j18=&i19=&j19=&i20=&j20=&i21=&j21=&i22=&j22=&i23=&j23=&i24=&j24=&i25=&j25=&i26=&j26=&i27=&j27=&i28=&j28=&i29=&j29=\" rel=\"noopener\">" + thisaudioih + "</a><iframe onload=\"if (navigator.userAgent.match(/Android|BlackBerry|iPhone|iPad|iPod|Opera Mini|IEMobile/i)) { document.getElementById('" + newaudioaid + "').target='" + newaudioifid + "';   if (this.src.indexOf('About_Us.') != -1) { document.getElementById('" + newaudioaid + "').target='" + newaudioifid + "'; this.src=document.getElementById('" + newaudioaid + "').href + '&rand=' + Math.floor(Math.random() * 1989786); } } \" id=" + newaudioifid + " name=" + newaudioifid + " src='//www.rjmprogramming.com.au/HTMLCSS/karaoke_youtube_api.htm?youtubeid=" + theytcode + "&theaid=" + newaudioaid + "&theiframeid=" + newaudioifid + "&thebuttonwording=" + encodeURIComponent(thisaudioit) + "&justaJUNKudio=&youtube_duration=22223.000&email=&emoji=on&c0=on&i0=0&j0=2&i1=&j1=&i2=&j2=&i3=&j3=&i4=&j4=&i5=&j5=&i6=&j6=&i7=&j7=&i8=&j8=&i9=&j9=&i10=&j10=&i11=&j11=&i12=&j12=&i13=&j13=&i14=&j14=&i15=&j15=&i16=&j16=&i17=&j17=&i18=&j18=&i19=&j19=&i20=&j20=&i21=&j21=&i22=&j22=&i23=&j23=&i24=&j24=&i25=&j25=&i26=&j26=&i27=&j27=&i28=&j28=&i29=&j29=' style=display:none;></iframe>");

   }

             //document.body.innerHTML=curdbih.replace(thisaudiooh, "<a class=processytplay id=\"" + newaudioaid + "\" target=\"_blank\" title=\"" + thisaudiotitle + "\" onmouseover=\"if (!navigator.userAgent.match(/Android|BlackBerry|iPhone|iPad|iPod|Opera Mini|IEMobile/i)) {  this.title+=' ';  this.target='" + newaudioifid + "'; } \" onclick=\"if (!navigator.userAgent.match(/Android|BlackBerry|iPhone|iPad|iPod|Opera Mini|IEMobile/i) && this.title == this.title.trim()) {  this.title+=' ';  this.target='" + newaudioifid + "';  document.getElementById('" + newaudioifid + "').src=this.href; } setTimeout(function(){ document.getElementById('" + newaudioaid + "').target='_blank'; },100);\" href=\"//www.rjmprogramming.com.au/HTMLCSS/karaoke_youtube_api.htm?youtubeid=" + theytcode + "&theaid=" + newaudioaid + "&theiframeid=" + newaudioifid + "&thebuttonwording=" + encodeURIComponent(thisaudioit) + "&justaJUNKudio=&youtube_duration=22223.000&email=&emoji=on&c0=on&i0=0&j0=2&i1=&j1=&i2=&j2=&i3=&j3=&i4=&j4=&i5=&j5=&i6=&j6=&i7=&j7=&i8=&j8=&i9=&j9=&i10=&j10=&i11=&j11=&i12=&j12=&i13=&j13=&i14=&j14=&i15=&j15=&i16=&j16=&i17=&j17=&i18=&j18=&i19=&j19=&i20=&j20=&i21=&j21=&i22=&j22=&i23=&j23=&i24=&j24=&i25=&j25=&i26=&j26=&i27=&j27=&i28=&j28=&i29=&j29=\" rel=\"noopener\">" + thisaudioih + "</a><iframe onload=\"if (navigator.userAgent.match(/Android|BlackBerry|iPhone|iPad|iPod|Opera Mini|IEMobile/i)) { document.getElementById('" + newaudioaid + "').target='" + newaudioifid + "';   if (this.src.indexOf('About_Us.') != -1) { document.getElementById('" + newaudioaid + "').target='" + newaudioifid + "'; this.src=document.getElementById('" + newaudioaid + "').href + '&rand=' + Math.floor(Math.random() * 1989786); } } \" id=" + newaudioifid + " name=" + newaudioifid + " src='//www.rjmprogramming.com.au/HTMLCSS/karaoke_youtube_api.htm?youtubeid=" + theytcode + "&theaid=" + newaudioaid + "&theiframeid=" + newaudioifid + "&thebuttonwording=" + encodeURIComponent(thisaudioit) + "&justaJUNKudio=&youtube_duration=22223.000&email=&emoji=on&c0=on&i0=0&j0=2&i1=&j1=&i2=&j2=&i3=&j3=&i4=&j4=&i5=&j5=&i6=&j6=&i7=&j7=&i8=&j8=&i9=&j9=&i10=&j10=&i11=&j11=&i12=&j12=&i13=&j13=&i14=&j14=&i15=&j15=&i16=&j16=&i17=&j17=&i18=&j18=&i19=&j19=&i20=&j20=&i21=&j21=&i22=&j22=&i23=&j23=&i24=&j24=&i25=&j25=&i26=&j26=&i27=&j27=&i28=&j28=&i29=&j29=' style=display:none;></iframe>");

             if (eval('' + audioonlyas[iuhg].getBoundingClientRect().height) > 60) {

             if (navigator.userAgent.match(/Android|BlackBerry|iPhone|iPad|iPod|Opera Mini|IEMobile/i) || 1 == 11) {

             onoroff='on';

             if (!navigator.userAgent.match(/Android|BlackBerry|iPhone|iPad|iPod|Opera Mini|IEMobile/i)) {  onoroff='off'; }

  //setTimeout(function(){

             //document.body.innerHTML=curdbih.replace(thisaudiooh, "<br><a style=display:inline-block; class=processytplay id=\"" + newaudioaid + "\" target=\"_blank\" title=\"" + thisaudiotitle + "\" data-onmouseover=\"if (!navigator.userAgent.match(/Android|BlackBerry|iPhone|iPad|iPod|Opera Mini|IEMobile/i)) {  this.title+=' ';  this.target='" + newaudioifid + "'; } \" onclick=\"if (!navigator.userAgent.match(/Android|BlackBerry|iPhone|iPad|iPod|Opera Mini|IEMobile/i) && this.title == this.title.trim()) {  this.title+=' ';  this.target='" + newaudioifid + "';  if (2 == 2) { document.getElementById('" + newaudioifid + "').src=this.href; } } setTimeout(function(){ document.getElementById('" + newaudioaid + "').target='_blank'; },100);\" href=\"//www.rjmprogramming.com.au/HTMLCSS/karaoke_youtube_api.htm?youtubeid=" + theytcode + "&theaid=" + newaudioaid + "&theiframeid=" + newaudioifid + "&thebuttonwording=" + encodeURIComponent(thisaudioih) + "&justaJUNKudio=&youtube_duration=22223.000&email=&emoji=on&c0=on&i0=" + spos + "&j0=" + altend + "&i1=&j1=&i2=&j2=&i3=&j3=&i4=&j4=&i5=&j5=&i6=&j6=&i7=&j7=&i8=&j8=&i9=&j9=&i10=&j10=&i11=&j11=&i12=&j12=&i13=&j13=&i14=&j14=&i15=&j15=&i16=&j16=&i17=&j17=&i18=&j18=&i19=&j19=&i20=&j20=&i21=&j21=&i22=&j22=&i23=&j23=&i24=&j24=&i25=&j25=&i26=&j26=&i27=&j27=&i28=&j28=&i29=&j29=\" rel=\"noopener\">" + thisaudioih + "</a><iframe onload=\"if (navigator.userAgent.match(/Android|BlackBerry|iPhone|iPad|iPod|Opera Mini|IEMobile/i)) { document.getElementById('" + newaudioaid + "').target='" + newaudioifid + "';   if (this.src.indexOf('About_Us.') != -1) { document.getElementById('" + newaudioaid + "').target='" + newaudioifid + "'; this.src=document.getElementById('" + newaudioaid + "').href + '&rand=' + Math.floor(Math.random() * 1989786); } } \" id=" + newaudioifid + " name=" + newaudioifid + " src='//www.rjmprogramming.com.au/HTMLCSS/karaoke_youtube_api.htm?youtubeid=" + theytcode + "&theaid=" + newaudioaid + "&theiframeid=" + newaudioifid + "&thebuttonwording=" + encodeURIComponent(thisaudioih) + "&justaJUNKudio=&youtube_duration=22223.000&email=&emoji=on&c0=on&i0=" + spos + "&j0=" + altend + "&i1=&j1=&i2=&j2=&i3=&j3=&i4=&j4=&i5=&j5=&i6=&j6=&i7=&j7=&i8=&j8=&i9=&j9=&i10=&j10=&i11=&j11=&i12=&j12=&i13=&j13=&i14=&j14=&i15=&j15=&i16=&j16=&i17=&j17=&i18=&j18=&i19=&j19=&i20=&j20=&i21=&j21=&i22=&j22=&i23=&j23=&i24=&j24=&i25=&j25=&i26=&j26=&i27=&j27=&i28=&j28=&i29=&j29=' style=display:none;width:" + audioonlyas[iuhg].getBoundingClientRect().width + "px;></iframe>");

        //dbidea.innerHTML=curdbih.replace(thisaudiooh, "<br><a style=display:inline-block; class=processytplay id=\"" + newaudioaid + "\" target='" + newaudioifid + "\' title=\"" + thisaudiotitle + "\" data-onmouseover=\"if (!navigator.userAgent.match(/Android|BlackBerry|iPhone|iPad|iPod|Opera Mini|IEMobile/i)) {  this.title+=' ';  this.target='" + newaudioifid + "'; } \" onclick=\"if (!navigator.userAgent.match(/Android|BlackBerry|iPhone|iPad|iPod|Opera Mini|IEMobile/i) && this.title == this.title.trim()) {  this.title+=' ';  this.target='" + newaudioifid + "';  if (2 == 2) { document.getElementById('" + newaudioifid + "').src=this.href; } } setTimeout(function(){ document.getElementById('" + newaudioaid + "').target='_blank'; },100);\" href=\"//www.rjmprogramming.com.au/HTMLCSS/karaoke_youtube_api.htm?youtubeid=" + theytcode + "&theaid=" + newaudioaid + "&theiframeid=" + newaudioifid + "&thebuttonwording=" + encodeURIComponent(thisaudioih) + "&justaJUNKudio=&youtube_duration=22223.000&email=&emoji=on&c0=on&i0=" + spos + "&j0=" + altend + "&i1=&j1=&i2=&j2=&i3=&j3=&i4=&j4=&i5=&j5=&i6=&j6=&i7=&j7=&i8=&j8=&i9=&j9=&i10=&j10=&i11=&j11=&i12=&j12=&i13=&j13=&i14=&j14=&i15=&j15=&i16=&j16=&i17=&j17=&i18=&j18=&i19=&j19=&i20=&j20=&i21=&j21=&i22=&j22=&i23=&j23=&i24=&j24=&i25=&j25=&i26=&j26=&i27=&j27=&i28=&j28=&i29=&j29=\" rel=\"noopener\">" + thisaudioih + "</a><iframe onload=\"if (navigator.userAgent.match(/Android|BlackBerry|iPhone|iPad|iPod|Opera Mini|IEMobile/i)) { document.getElementById('" + newaudioaid + "').target='" + newaudioifid + "';   if (this.src.indexOf('About_Us.') != -1) { document.getElementById('" + newaudioaid + "').target='" + newaudioifid + "'; this.src=document.getElementById('" + newaudioaid + "').href + '&rand=' + Math.floor(Math.random() * 1989786); } } \" id=" + newaudioifid + " name=" + newaudioifid + " src='//www.rjmprogramming.com.au/HTMLCSS/karaoke_youtube_api.htm?youtubeid=" + theytcode + "&theaid=" + newaudioaid + "&theiframeid=" + newaudioifid + "&thebuttonwording=" + encodeURIComponent(thisaudioih) + "&justaJUNKudio=&youtube_duration=22223.000&email=&emoji=on&c0=on&i0=" + spos + "&j0=" + altend + "&i1=&j1=&i2=&j2=&i3=&j3=&i4=&j4=&i5=&j5=&i6=&j6=&i7=&j7=&i8=&j8=&i9=&j9=&i10=&j10=&i11=&j11=&i12=&j12=&i13=&j13=&i14=&j14=&i15=&j15=&i16=&j16=&i17=&j17=&i18=&j18=&i19=&j19=&i20=&j20=&i21=&j21=&i22=&j22=&i23=&j23=&i24=&j24=&i25=&j25=&i26=&j26=&i27=&j27=&i28=&j28=&i29=&j29=' style=display:none;width:" + audioonlyas[iuhg].getBoundingClientRect().width + "px;></iframe>");

             ////dbidea.innerHTML=curdbih.replace(thisaudiooh, "<br><div style=display:inline-block; class=processytplay id=\"" + newaudioaid + "\" target='" + newaudioifid + "\' title=\"" + thisaudiotitle + "\" data-onmouseover=\"if (!navigator.userAgent.match(/Android|BlackBerry|iPhone|iPad|iPod|Opera Mini|IEMobile/i)) {  this.title+=' ';  this.target='" + newaudioifid + "'; } \" onclick=\"if (!navigator.userAgent.match(/Android|BlackBerry|iPhone|iPad|iPod|Opera Mini|IEMobile/i) && this.title == this.title.trim()) {  this.title+=' ';  this.target='" + newaudioifid + "';  if (2 == 2) { document.getElementById('" + newaudioifid + "').src=this.title; } } setTimeout(function(){ document.getElementById('" + newaudioaid + "').target='_blank'; },100);\" title=\"//www.rjmprogramming.com.au/HTMLCSS/karaoke_youtube_api.htm?youtubeid=" + theytcode + "&theaid=" + newaudioaid + "&theiframeid=" + newaudioifid + "&thebuttonwording=" + encodeURIComponent(thisaudioih) + "&justaJUNKudio=&youtube_duration=22223.000&email=&emoji=on&c0=on&i0=" + spos + "&j0=" + altend + "&i1=&j1=&i2=&j2=&i3=&j3=&i4=&j4=&i5=&j5=&i6=&j6=&i7=&j7=&i8=&j8=&i9=&j9=&i10=&j10=&i11=&j11=&i12=&j12=&i13=&j13=&i14=&j14=&i15=&j15=&i16=&j16=&i17=&j17=&i18=&j18=&i19=&j19=&i20=&j20=&i21=&j21=&i22=&j22=&i23=&j23=&i24=&j24=&i25=&j25=&i26=&j26=&i27=&j27=&i28=&j28=&i29=&j29=\" rel=\"noopener\">" + thisaudioih + "</div><div id=idiJUNKvf><iframe onload=\"if (navigator.userAgent.match(/Android|BlackBerry|iPhone|iPad|iPod|Opera Mini|IEMobile/i)) { document.getElementById('" + newaudioaid + "').target='" + newaudioifid + "';   if (this.src.indexOf('About_Us.') != -1) { document.getElementById('" + newaudioaid + "').target='" + newaudioifid + "'; this.src=document.getElementById('" + newaudioaid + "').href + '&rand=' + Math.floor(Math.random() * 1989786); } } \" id=" + newaudioifid + " name=" + newaudioifid + " src='//www.rjmprogramming.com.au/HTMLCSS/karaoke_youtube_api.htm?youtubeid=" + theytcode + "&theaid=" + newaudioaid + "&theiframeid=" + newaudioifid + "&thebuttonwording=" + encodeURIComponent(thisaudioih) + "&justaJUNKudio=&youtube_duration=22223.000&email=&emoji=on&c0=on&i0=" + spos + "&j0=" + altend + "&i1=&j1=&i2=&j2=&i3=&j3=&i4=&j4=&i5=&j5=&i6=&j6=&i7=&j7=&i8=&j8=&i9=&j9=&i10=&j10=&i11=&j11=&i12=&j12=&i13=&j13=&i14=&j14=&i15=&j15=&i16=&j16=&i17=&j17=&i18=&j18=&i19=&j19=&i20=&j20=&i21=&j21=&i22=&j22=&i23=&j23=&i24=&j24=&i25=&j25=&i26=&j26=&i27=&j27=&i28=&j28=&i29=&j29=' style=display:none;width:" + audioonlyas[iuhg].getBoundingClientRect().width + "px;></iframe></div>");

//alert(344);

             // // //dbidea.innerHTML=curdbih.replace(thisaudiooh, "<br><div style=display:inline-block; class=processytplay id=\"" + newaudioaid + "\" data-target='" + newaudioifid + "\' data-title=\"" + thisaudiotitle + "\" data-onmouseover=\"if (!navigator.userAgent.match(/Android|BlackBerry|iPhone|iPad|iPod|Opera Mini|IEMobile/i)) {  this.title+=' ';  this.target='" + newaudioifid + "'; } \" onclick=\"if (!navigator.userAgent.match(/Android|BlackBerry|iPhone|iPad|iPod|Opera Mini|IEMobile/i) && this.title == this.title.trim()) {  this.title+=' ';  this.target='" + newaudioifid + "';  if (2 == 2) { document.getElementById('" + newaudioifid + "').src=this.title; } } setTimeout(function(){ document.getElementById('" + newaudioaid + "').target='_blank'; },100);\" title=\"//www.rjmprogramming.com.au/HTMLCSS/karaoke_youtube_api.htm?youtubeid=" + theytcode + "&theaid=" + newaudioaid + "&theiframeid=" + newaudioifid + "&thebuttonwording=" + encodeURIComponent(thisaudioih) + "&justaJUNKudio=&youtube_duration=22223.000&email=&emoji=on&c0=on&i0=" + spos + "&j0=" + altend + "&i1=&j1=&i2=&j2=&i3=&j3=&i4=&j4=&i5=&j5=&i6=&j6=&i7=&j7=&i8=&j8=&i9=&j9=&i10=&j10=&i11=&j11=&i12=&j12=&i13=&j13=&i14=&j14=&i15=&j15=&i16=&j16=&i17=&j17=&i18=&j18=&i19=&j19=&i20=&j20=&i21=&j21=&i22=&j22=&i23=&j23=&i24=&j24=&i25=&j25=&i26=&j26=&i27=&j27=&i28=&j28=&i29=&j29=\" rel=\"noopener\">" + thisaudioih + "</div><div id=idiJUNKvf><iframe onload=\"if (navigator.userAgent.match(/Android|BlackBerry|iPhone|iPad|iPod|Opera Mini|IEMobile/i)) { document.getElementById('" + newaudioaid + "').target='" + newaudioifid + "';   if (this.src.indexOf('About_Us.') != -1) { document.getElementById('" + newaudioaid + "').target='" + newaudioifid + "'; this.src=document.getElementById('" + newaudioaid + "').title + '&rand=' + Math.floor(Math.random() * 1989786); } } \" id=" + newaudioifid + " name=" + newaudioifid + " src='/About_Us.html' style=display:none;width:" + audioonlyas[iuhg].getBoundingClientRect().width + "px;></iframe></div>");


             //sscidea=decodeURIComponent(('' + window.sessionStorage.getItem('_words_' + window.btoa(thisaudioit))).replace(/^null/g,'').replace(/^undefined/g,''));

             //if (sscidea != '') {

             //dbidea.innerHTML=curdbih.replace(thisaudiooh + suffixin, sscidea + suffixout);

             //} else {

             //window.sessionStorage.setItem('_words_' + window.btoa(thisaudioit), encodeURIComponent("<br><!--div style=display:inline-block; class=processytplay id=\"" + newaudioaid + "\" data-target='" + newaudioifid + "\' data-title=\"" + thisaudiotitle + "\" data-onmouseover=\"if (!navigator.userAgent.match(/Android|BlackBerry|iPhone|iPad|iPod|Opera Mini|IEMobile/i)) {  this.title+=' ';   } \" onclick=\"if (!navigator.userAgent.match(/Android|BlackBerry|iPhone|iPad|iPod|Opera Mini|IEMobile/i) && this.title == this.title.trim()) {  this.title+=' ';   if (document.getElementById('" + newaudioifid + "').src != this.title.trim()) { document.getElementById('" + newaudioifid + "').src=this.title.trim(); } } \" title=\"//www.rjmprogramming.com.au/HTMLCSS/karaoke_youtube_api.htm?youtubeid=" + theytcode + "&theaid=" + newaudioaid + "&theiframeid=" + newaudioifid + "&thebuttonwording=" + encodeURIComponent(thisaudioih) + "&justaudio=&youtube_duration=22223.000&email=&emoji=on&c0=on&i0=" + spos + "&j0=" + altend + "&i1=&j1=&i2=&j2=&i3=&j3=&i4=&j4=&i5=&j5=&i6=&j6=&i7=&j7=&i8=&j8=&i9=&j9=&i10=&j10=&i11=&j11=&i12=&j12=&i13=&j13=&i14=&j14=&i15=&j15=&i16=&j16=&i17=&j17=&i18=&j18=&i19=&j19=&i20=&j20=&i21=&j21=&i22=&j22=&i23=&j23=&i24=&j24=&i25=&j25=&i26=&j26=&i27=&j27=&i28=&j28=&i29=&j29=\" rel=\"noopener\"--><iframe data-onload=\"if (navigator.userAgent.match(/Android|BlackBerry|iPhone|iPad|iPod|Opera Mini|IEMobile/i)) {    if (this.src.indexOf('About_Us.') != -1) {  this.src=document.getElementById('" + newaudioaid + "').title.trim() + '&rand=' + Math.floor(Math.random() * 1989786); } } \" id=" + newaudioifid + " name=" + newaudioifid + " src='//www.rjmprogramming.com.au/HTMLCSS/karaoke_youtube_api.htm?youtubeid=" + theytcode + "&theaid=" + newaudioaid + "&theiframeid=" + newaudioifid + "&thebuttonwording=" + encodeURIComponent(thisaudioih) + "&justaudio=&youtube_duration=22223.000&email=&emoji=on&c0=on&i0=" + spos + "&j0=" + altend + "&i1=&j1=&i2=&j2=&i3=&j3=&i4=&j4=&i5=&j5=&i6=&j6=&i7=&j7=&i8=&j8=&i9=&j9=&i10=&j10=&i11=&j11=&i12=&j12=&i13=&j13=&i14=&j14=&i15=&j15=&i16=&j16=&i17=&j17=&i18=&j18=&i19=&j19=&i20=&j20=&i21=&j21=&i22=&j22=&i23=&j23=&i24=&j24=&i25=&j25=&i26=&j26=&i27=&j27=&i28=&j28=&i29=&j29=' style=display:inline-block;width:" + audioonlyas[iuhg].getBoundingClientRect().width + "px;height:" + audioonlyas[iuhg].getBoundingClientRect().height + "px;></iframe><!--/div-->"));

//             dbidea.innerHTML=curdbih.replace(thisaudiooh + suffixin, "<br><div style='width:100%;' data-pp='pause' data-ts=\"" + ('' + new Date()) + "\" data-it=\"" + encodeURIComponent(thisaudioit) + "\" data-at='0.0000' data-duration='22223.0000' ontouchstart=onmaybesupclick(event); onmousedown=onmaybesupclick(event); style=display:inline-block; class=processytplay id=\"" + newaudioaid + "\" data-target='" + newaudioifid + "\' data-title=\"" + thisaudiotitle + "\" data-onmouseover=\"if (!navigator.userAgent.match(/Android|BlackBerry|iPhone|iPad|iPod|Opera Mini|IEMobile/i)) {  this.title+=' ';   } \" onclick=\"if (!navigator.userAgent.match(/Android|BlackBerry|iPhone|iPad|iPod|Opera Mini|IEMobile/i) && this.title == this.title.trim()) {  document.getElementById('inp" + newaudioaid + "_" + newaudioifid + "').style.display='inline-block';   this.title+=' ';   if (2 == 2) { document.getElementById('" + newaudioifid + "').src=this.title.trim(); } } \" title=\"//www.rjmprogramming.com.au/HTMLCSS/karaoke_youtube_api.htm?youtubeid=" + theytcode + "&theaid=" + newaudioaid + "&theiframeid=" + newaudioifid + "&thebuttonwording=" + encodeURIComponent(thisaudioih.replace(/\'/g,'`') + audioemoji.replace('<sup','<sup id="sup' + newaudioaid + '_' + newaudioifid + '" ')) + "&justaJUNKudio=&youtube_duration=22223.000&email=&emoji=on&c0=" + onoroff + "&i0=" + spos + "&j0=" + altend + "&i1=&j1=&i2=&j2=&i3=&j3=&i4=&j4=&i5=&j5=&i6=&j6=&i7=&j7=&i8=&j8=&i9=&j9=&i10=&j10=&i11=&j11=&i12=&j12=&i13=&j13=&i14=&j14=&i15=&j15=&i16=&j16=&i17=&j17=&i18=&j18=&i19=&j19=&i20=&j20=&i21=&j21=&i22=&j22=&i23=&j23=&i24=&j24=&i25=&j25=&i26=&j26=&i27=&j27=&i28=&j28=&i29=&j29=\" rel=\"noopener\"><iframe data-onload=\"if (navigator.userAgent.match(/Android|BlackBerry|iPhone|iPad|iPod|Opera Mini|IEMobile/i)) {    if (this.src.indexOf('About_Us.') != -1) {  this.src=document.getElementById('" + newaudioaid + "').title.trim() + '&rand=' + Math.floor(Math.random() * 1989786); } } \" id=" + newaudioifid + " name=" + newaudioifid + " src='//www.rjmprogramming.com.au/HTMLCSS/karaoke_youtube_api.htm?youtubeid=" + theytcode + "&theaid=" + newaudioaid + "&theiframeid=" + newaudioifid + "&thebuttonwording=" + encodeURIComponent(thisaudioih.replace(/\'/g,'`') + audioemoji.replace('<sup','<sup id="sup' + newaudioaid + '_' + newaudioifid + '" ')) + "&justaJUNKudio=&youtube_duration=22223.000&email=&emoji=on&c0=on&i0=" + spos + "&j0=" + altend + "&i1=&j1=&i2=&j2=&i3=&j3=&i4=&j4=&i5=&j5=&i6=&j6=&i7=&j7=&i8=&j8=&i9=&j9=&i10=&j10=&i11=&j11=&i12=&j12=&i13=&j13=&i14=&j14=&i15=&j15=&i16=&j16=&i17=&j17=&i18=&j18=&i19=&j19=&i20=&j20=&i21=&j21=&i22=&j22=&i23=&j23=&i24=&j24=&i25=&j25=&i26=&j26=&i27=&j27=&i28=&j28=&i29=&j29=' style=display:inline-block;width:" + eval(2.2 * audioonlyas[iuhg].getBoundingClientRect().width) + "px;height:" + eval(4.2 * audioonlyas[iuhg].getBoundingClientRect().height) + "px;></iframe><textarea rows=3 data-loop='' data-val='' id='inp" + newaudioaid + "_" + newaudioifid + "' style=background-color:rgb(250,250,250);display:inline-block;width:95%;font-size:12px;; type=text onblur=ansis(event); placeholder='Audio control ... P=pause/play S=stop M=mute U=unmute L=loop ...'  id= value=''></textarea><div style=display:inline-block; id='ldi" + newaudioaid + "'><!--input type=text style=position:absolute;top:-567px;left:-564px; value=''></input--></div></div>" + suffixout);

             if (dbidea.innerHTML == audioonlyas[iuhg].outerHTML) {

             onefound=true;

             dbidea.innerHTML=("<br><div style='width:100%;' data-pp='pause' data-ts=\"" + ('' + new Date()) + "\" data-it=\"" + encodeURIComponent(thisaudioit) + "\" data-at='0.0000' data-duration='22223.0000' ontouchstart=onmaybesupclick(event); onmousedown=onmaybesupclick(event); style=display:inline-block; class=processytplay id=\"" + newaudioaid + "\" data-target='" + newaudioifid + "\' data-title=\"" + thisaudiotitle + "\" data-onmouseover=\"if (!navigator.userAgent.match(/Android|BlackBerry|iPhone|iPad|iPod|Opera Mini|IEMobile/i)) {  this.title+=' ';   } \" onclick=\"if (!navigator.userAgent.match(/Android|BlackBerry|iPhone|iPad|iPod|Opera Mini|IEMobile/i) && this.title == this.title.trim()) {  document.getElementById('inp" + newaudioaid + "_" + newaudioifid + "').style.display='inline-block';   this.title+=' ';   if (2 == 2) { document.getElementById('" + newaudioifid + "').src=this.title.trim(); } } \" title=\"//www.rjmprogramming.com.au/HTMLCSS/karaoke_youtube_api.htm?youtubeid=" + theytcode + "&theaid=" + newaudioaid + "&theiframeid=" + newaudioifid + "&thebuttonwording=" + encodeURIComponent(thisaudioih.replace(/\'/g,'`') + audioemoji.replace('<sup','<sup id="sup' + newaudioaid + '_' + newaudioifid + '" ')) + "&justaJUNKudio=&youtube_duration=22223.000&email=&emoji=on&c0=" + onoroff + "&i0=" + spos + "&j0=" + altend + "&i1=&j1=&i2=&j2=&i3=&j3=&i4=&j4=&i5=&j5=&i6=&j6=&i7=&j7=&i8=&j8=&i9=&j9=&i10=&j10=&i11=&j11=&i12=&j12=&i13=&j13=&i14=&j14=&i15=&j15=&i16=&j16=&i17=&j17=&i18=&j18=&i19=&j19=&i20=&j20=&i21=&j21=&i22=&j22=&i23=&j23=&i24=&j24=&i25=&j25=&i26=&j26=&i27=&j27=&i28=&j28=&i29=&j29=\" rel=\"noopener\"><iframe data-onload=\"if (navigator.userAgent.match(/Android|BlackBerry|iPhone|iPad|iPod|Opera Mini|IEMobile/i)) {    if (this.src.indexOf('About_Us.') != -1) {  this.src=document.getElementById('" + newaudioaid + "').title.trim() + '&rand=' + Math.floor(Math.random() * 1989786); } } \" id=" + newaudioifid + " name=" + newaudioifid + " src='//www.rjmprogramming.com.au/HTMLCSS/karaoke_youtube_api.htm?youtubeid=" + theytcode + "&theaid=" + newaudioaid + "&theiframeid=" + newaudioifid + "&thebuttonwording=" + encodeURIComponent(thisaudioih.replace(/\'/g,'`') + audioemoji.replace('<sup','<sup id="sup' + newaudioaid + '_' + newaudioifid + '" ')) + "&justaJUNKudio=&youtube_duration=22223.000&email=&emoji=on&c0=on&i0=" + spos + "&j0=" + altend + "&i1=&j1=&i2=&j2=&i3=&j3=&i4=&j4=&i5=&j5=&i6=&j6=&i7=&j7=&i8=&j8=&i9=&j9=&i10=&j10=&i11=&j11=&i12=&j12=&i13=&j13=&i14=&j14=&i15=&j15=&i16=&j16=&i17=&j17=&i18=&j18=&i19=&j19=&i20=&j20=&i21=&j21=&i22=&j22=&i23=&j23=&i24=&j24=&i25=&j25=&i26=&j26=&i27=&j27=&i28=&j28=&i29=&j29=' style=display:inline-block;width:" + eval(2.2 * audioonlyas[iuhg].getBoundingClientRect().width) + "px;height:" + eval(4.2 * audioonlyas[iuhg].getBoundingClientRect().height) + "px;></iframe><textarea rows=3 data-loop='' data-mute='' data-val='' id='inp" + newaudioaid + "_" + newaudioifid + "' style=background-color:rgb(250,250,250);display:inline-block;width:95%;font-size:12px;; type=text onblur=ansis(event); placeholder='Audio control ... P=pause/play S=stop M=mute U=unmute L=loop ...'  id= value=''></textarea><div style=display:inline-block; id='ldi" + newaudioaid + "'><!--input type=text style=position:absolute;top:-567px;left:-564px; value=''></input--></div></div>" + suffixout);

             } else {

             onefound=true;

             dbidea.innerHTML=dbidea.innerHTML.replace(audioonlyas[iuhg].outerHTML + suffixin, "<br><div style='width:100%;' data-pp='pause' data-ts=\"" + ('' + new Date()) + "\" data-it=\"" + encodeURIComponent(thisaudioit) + "\" data-at='0.0000' data-duration='22223.0000' ontouchstart=onmaybesupclick(event); onmousedown=onmaybesupclick(event); style=display:inline-block; class=processytplay id=\"" + newaudioaid + "\" data-target='" + newaudioifid + "\' data-title=\"" + thisaudiotitle + "\" data-onmouseover=\"if (!navigator.userAgent.match(/Android|BlackBerry|iPhone|iPad|iPod|Opera Mini|IEMobile/i)) {  this.title+=' ';   } \" onclick=\"if (!navigator.userAgent.match(/Android|BlackBerry|iPhone|iPad|iPod|Opera Mini|IEMobile/i) && this.title == this.title.trim()) {  document.getElementById('inp" + newaudioaid + "_" + newaudioifid + "').style.display='inline-block';   this.title+=' ';   if (2 == 2) { document.getElementById('" + newaudioifid + "').src=this.title.trim(); } } \" title=\"//www.rjmprogramming.com.au/HTMLCSS/karaoke_youtube_api.htm?youtubeid=" + theytcode + "&theaid=" + newaudioaid + "&theiframeid=" + newaudioifid + "&thebuttonwording=" + encodeURIComponent(thisaudioih.replace(/\'/g,'`') + audioemoji.replace('<sup','<sup id="sup' + newaudioaid + '_' + newaudioifid + '" ')) + "&justaJUNKudio=&youtube_duration=22223.000&email=&emoji=on&c0=" + onoroff + "&i0=" + spos + "&j0=" + altend + "&i1=&j1=&i2=&j2=&i3=&j3=&i4=&j4=&i5=&j5=&i6=&j6=&i7=&j7=&i8=&j8=&i9=&j9=&i10=&j10=&i11=&j11=&i12=&j12=&i13=&j13=&i14=&j14=&i15=&j15=&i16=&j16=&i17=&j17=&i18=&j18=&i19=&j19=&i20=&j20=&i21=&j21=&i22=&j22=&i23=&j23=&i24=&j24=&i25=&j25=&i26=&j26=&i27=&j27=&i28=&j28=&i29=&j29=\" rel=\"noopener\"><iframe data-onload=\"if (navigator.userAgent.match(/Android|BlackBerry|iPhone|iPad|iPod|Opera Mini|IEMobile/i)) {    if (this.src.indexOf('About_Us.') != -1) {  this.src=document.getElementById('" + newaudioaid + "').title.trim() + '&rand=' + Math.floor(Math.random() * 1989786); } } \" id=" + newaudioifid + " name=" + newaudioifid + " src='//www.rjmprogramming.com.au/HTMLCSS/karaoke_youtube_api.htm?youtubeid=" + theytcode + "&theaid=" + newaudioaid + "&theiframeid=" + newaudioifid + "&thebuttonwording=" + encodeURIComponent(thisaudioih.replace(/\'/g,'`') + audioemoji.replace('<sup','<sup id="sup' + newaudioaid + '_' + newaudioifid + '" ')) + "&justaJUNKudio=&youtube_duration=22223.000&email=&emoji=on&c0=on&i0=" + spos + "&j0=" + altend + "&i1=&j1=&i2=&j2=&i3=&j3=&i4=&j4=&i5=&j5=&i6=&j6=&i7=&j7=&i8=&j8=&i9=&j9=&i10=&j10=&i11=&j11=&i12=&j12=&i13=&j13=&i14=&j14=&i15=&j15=&i16=&j16=&i17=&j17=&i18=&j18=&i19=&j19=&i20=&j20=&i21=&j21=&i22=&j22=&i23=&j23=&i24=&j24=&i25=&j25=&i26=&j26=&i27=&j27=&i28=&j28=&i29=&j29=' style=display:inline-block;width:" + eval(2.2 * audioonlyas[iuhg].getBoundingClientRect().width) + "px;height:" + eval(4.2 * audioonlyas[iuhg].getBoundingClientRect().height) + "px;></iframe><textarea rows=3 data-loop='' data-mute='' data-val='' id='inp" + newaudioaid + "_" + newaudioifid + "' style=background-color:rgb(250,250,250);display:inline-block;width:95%;font-size:12px;; type=text onblur=ansis(event); placeholder='Audio control ... P=pause/play S=stop M=mute U=unmute L=loop ...'  id= value=''></textarea><div style=display:inline-block; id='ldi" + newaudioaid + "'><!--input type=text style=position:absolute;top:-567px;left:-564px; value=''></input--></div></div>" + suffixout);

             }

             if (dbidea.outerHTML.split('>')[0].indexOf('placeforvideo') != -1 || dbidea.outerHTML.split('>')[0].indexOf('areyousinging') != -1) {

               dbidea.style.visibility='visible';

             }

             //}

  //}, 8000);

             } else {

             //document.body.innerHTML=curdbih.replace(thisaudiooh, "<br><a class=processytplay id=\"" + newaudioaid + "\" target='" + newaudioifid + "\' title=\"" + thisaudiotitle + "\" onmouseover=\"if (!navigator.userAgent.match(/Android|BlackBerry|iPhone|iPad|iPod|Opera Mini|IEMobile/i)) {  this.title+=' ';  this.target='" + newaudioifid + "'; } \" onclick=\"if (!navigator.userAgent.match(/Android|BlackBerry|iPhone|iPad|iPod|Opera Mini|IEMobile/i) && this.title == this.title.trim()) {  this.title+=' ';  this.target='" + newaudioifid + "';  document.getElementById('" + newaudioifid + "').src=this.href; } setTimeout(function(){ document.getElementById('" + newaudioaid + "').target='_blank'; },100);\" href=\"//www.rjmprogramming.com.au/HTMLCSS/karaoke_youtube_api.htm?youtubeid=" + theytcode + "&theaid=" + newaudioaid + "&theiframeid=" + newaudioifid + "&thebuttonwording=" + encodeURIComponent(thisaudioih) + "&justaJUNKudio=&youtube_duration=22223.000&email=&emoji=on&c0=on&i0=" + spos + "&j0=" + altend + "&i1=&j1=&i2=&j2=&i3=&j3=&i4=&j4=&i5=&j5=&i6=&j6=&i7=&j7=&i8=&j8=&i9=&j9=&i10=&j10=&i11=&j11=&i12=&j12=&i13=&j13=&i14=&j14=&i15=&j15=&i16=&j16=&i17=&j17=&i18=&j18=&i19=&j19=&i20=&j20=&i21=&j21=&i22=&j22=&i23=&j23=&i24=&j24=&i25=&j25=&i26=&j26=&i27=&j27=&i28=&j28=&i29=&j29=\" rel=\"noopener\">" + thisaudioih + "</a><div id=idivf><iframe onload=\"if (navigator.userAgent.match(/Android|BlackBerry|iPhone|iPad|iPod|Opera Mini|IEMobile/i)) { document.getElementById('" + newaudioaid + "').target='" + newaudioifid + "';   if (this.src.indexOf('About_Us.') != -1) { document.getElementById('" + newaudioaid + "').target='" + newaudioifid + "'; this.src=document.getElementById('" + newaudioaid + "').href + '&rand=' + Math.floor(Math.random() * 1989786); } } \" id=" + newaudioifid + " name=" + newaudioifid + " src='/About_Us.html' style=display:none;></iframe></div>");

//alert(98);

//             dbidea.innerHTML=curdbih.replace(thisaudiooh + suffixin, "<br><a data-pp='pause' data-ts=\"" + ('' + new Date()) + "\" data-it=\"" + encodeURIComponent(thisaudioit) + "\" data-at='0.0000' data-duration='22223.0000' oncontextmenu=\"window.open('//www.rjmprogramming.com.au/HTMLCSS/karaoke_youtube_api.htm?youtubeid=" + theytcode + "&theaNOid=" + newaudioaid + "&theifrNOameid=" + newaudioifid + "&thebuttoNOnwording=" + encodeURIComponent(thisaudioih.replace(/\'/g,'`') + audioemoji.replace('<sup','<sup id="sup' + newaudioaid + '_' + newaudioifid + '" ')) + "&justaJUNKudio=&youtube_duration=22223.000&email=&emoji=on&c0=on&i0=" + spos + "&j0=" + altend + "&i1=&j1=&i2=&j2=&i3=&j3=&i4=&j4=&i5=&j5=&i6=&j6=&i7=&j7=&i8=&j8=&i9=&j9=&i10=&j10=&i11=&j11=&i12=&j12=&i13=&j13=&i14=&j14=&i15=&j15=&i16=&j16=&i17=&j17=&i18=&j18=&i19=&j19=&i20=&j20=&i21=&j21=&i22=&j22=&i23=&j23=&i24=&j24=&i25=&j25=&i26=&j26=&i27=&j27=&i28=&j28=&i29=&j29=','_blank');\" class=processytplay id=\"" + newaudioaid + "\" target='" + newaudioifid + "\' title=\"" + thisaudiotitle + "\" data-onmouseover=\"if (!navigator.userAgent.match(/Android|BlackBerry|iPhone|iPad|iPod|Opera Mini|IEMobile/i)) {  this.title+=' ';  this.target='" + newaudioifid + "'; } \" onclick=\"if (!navigator.userAgent.match(/Android|BlackBerry|iPhone|iPad|iPod|Opera Mini|IEMobile/i) && this.title == this.title.trim()) {  document.getElementById('spn" + newaudioaid + "_" + newaudioifid + "').style.display='inline-block';   document.getElementById('inp" + newaudioaid + "_" + newaudioifid + "').style.display='inline-block';   if (okdclick) {  this.title+=' ';  this.target='" + newaudioifid + "';  if (document.getElementById('" + newaudioifid + "').src != this.href) { document.getElementById('" + newaudioifid + "').src=this.href; this.href=this.href.replace('thebuttonwording=','thatbuttonwording='); } } } if (9 == 6) { setTimeout(function(){ document.getElementById('" + newaudioaid + "').target='_blank'; },100); }\" href=\"//www.rjmprogramming.com.au/HTMLCSS/karaoke_youtube_api.htm?youtubeid=" + theytcode + "&theaid=" + newaudioaid + "&theiframeid=" + newaudioifid + "&thebuttonwording=" + encodeURIComponent(thisaudioih.replace(/\'/g,'`') + audioemoji.replace('<sup','<sup id="sup' + newaudioaid + '_' + newaudioifid + '" ')) + "&justaJUNKudio=&youtube_duration=22223.000&email=&emoji=on&c0=on&i0=" + spos + "&j0=" + altend + "&i1=&j1=&i2=&j2=&i3=&j3=&i4=&j4=&i5=&j5=&i6=&j6=&i7=&j7=&i8=&j8=&i9=&j9=&i10=&j10=&i11=&j11=&i12=&j12=&i13=&j13=&i14=&j14=&i15=&j15=&i16=&j16=&i17=&j17=&i18=&j18=&i19=&j19=&i20=&j20=&i21=&j21=&i22=&j22=&i23=&j23=&i24=&j24=&i25=&j25=&i26=&j26=&i27=&j27=&i28=&j28=&i29=&j29=\" rel=\"noopener\">" + thisaudioih + "</a><div id=idivf style=display:inline-block;><iframe onload=\"if (navigator.userAgent.match(/Android|BlackBerry|iPhone|iPad|iPod|Opera Mini|IEMobile/i)) { document.getElementById('" + newaudioaid + "').target='" + newaudioifid + "';   if (this.src.indexOf('About_Us.') != -1) { document.getElementById('" + newaudioaid + "').target='" + newaudioifid + "'; this.src=document.getElementById('" + newaudioaid + "').href + '&rand=' + Math.floor(Math.random() * 1989786);  document.getElementById('" + newaudioaid + "').title+=' ';  } } \" id=" + newaudioifid + " name=" + newaudioifid + " src='//www.rjmprogramming.com.au/HTMLCSS/karaoke_youtube_api.htm?youtubeid=" + theytcode + "&theaid=" + newaudioaid + "&theiframeid=" + newaudioifid + "&thebuttonwording=" + encodeURIComponent(thisaudioih.replace(/\'/g,'`') + audioemoji.replace('<sup','<sup id="sup' + newaudioaid + '_' + newaudioifid + '" ')) + "&justaJUNKudio=&youtube_duration=22223.000&email=&emoji=on&c0=off&i0=" + spos + "&j0=" + altend + "&i1=&j1=&i2=&j2=&i3=&j3=&i4=&j4=&i5=&j5=&i6=&j6=&i7=&j7=&i8=&j8=&i9=&j9=&i10=&j10=&i11=&j11=&i12=&j12=&i13=&j13=&i14=&j14=&i15=&j15=&i16=&j16=&i17=&j17=&i18=&j18=&i19=&j19=&i20=&j20=&i21=&j21=&i22=&j22=&i23=&j23=&i24=&j24=&i25=&j25=&i26=&j26=&i27=&j27=&i28=&j28=&i29=&j29=' style=display:none;visibility:hidden;width:" + audioonlyas[iuhg].getBoundingClientRect().width + "px;height:" + audioonlyas[iuhg].getBoundingClientRect().height + "px;></iframe><div id='spn" + newaudioaid + "_" + newaudioifid + "' style=display:NONE;white-space:pre-line;> <br><textarea data-loop='' rows=4 data-val='' id='inp" + newaudioaid + "_" + newaudioifid + "' style=background-color:rgb(250,250,250);display:NONE;width:95%;font-size:8px;  data-loop='' data-val='' type=text onblur=ansis(event); placeholder='Audio control ... P=pause/play S=stop M=mute U=unmute L=loop ...' value=''></textarea></div><div style=display:inline-block; id='ldi" + newaudioaid + "'><!--input type=text style=position:absolute;top:-567px;left:-564px; value=''></input--></div></div>" + suffixout);

             if (dbidea.innerHTML == audioonlyas[iuhg].outerHTML) {

             onefound=true;

             dbidea.innerHTML=("<br><a data-pp='pause' data-ts=\"" + ('' + new Date()) + "\" data-it=\"" + encodeURIComponent(thisaudioit) + "\" data-at='0.0000' data-duration='22223.0000' oncontextmenu=\"window.open('//www.rjmprogramming.com.au/HTMLCSS/karaoke_youtube_api.htm?youtubeid=" + theytcode + "&theaNOid=" + newaudioaid + "&theifrNOameid=" + newaudioifid + "&thebuttoNOnwording=" + encodeURIComponent(thisaudioih.replace(/\'/g,'`') + audioemoji.replace('<sup','<sup id="sup' + newaudioaid + '_' + newaudioifid + '" ')) + "&justaJUNKudio=&youtube_duration=22223.000&email=&emoji=on&c0=on&i0=" + spos + "&j0=" + altend + "&i1=&j1=&i2=&j2=&i3=&j3=&i4=&j4=&i5=&j5=&i6=&j6=&i7=&j7=&i8=&j8=&i9=&j9=&i10=&j10=&i11=&j11=&i12=&j12=&i13=&j13=&i14=&j14=&i15=&j15=&i16=&j16=&i17=&j17=&i18=&j18=&i19=&j19=&i20=&j20=&i21=&j21=&i22=&j22=&i23=&j23=&i24=&j24=&i25=&j25=&i26=&j26=&i27=&j27=&i28=&j28=&i29=&j29=','_blank');\" class=processytplay id=\"" + newaudioaid + "\" target='" + newaudioifid + "\' title=\"" + thisaudiotitle + "\" data-onmouseover=\"if (!navigator.userAgent.match(/Android|BlackBerry|iPhone|iPad|iPod|Opera Mini|IEMobile/i)) {  this.title+=' ';  this.target='" + newaudioifid + "'; } \" onclick=\"if (!navigator.userAgent.match(/Android|BlackBerry|iPhone|iPad|iPod|Opera Mini|IEMobile/i) && this.title == this.title.trim()) {  document.getElementById('spn" + newaudioaid + "_" + newaudioifid + "').style.display='inline-block';   document.getElementById('inp" + newaudioaid + "_" + newaudioifid + "').style.display='inline-block';   if (okdclick) {  this.title+=' ';  this.target='" + newaudioifid + "';  if (document.getElementById('" + newaudioifid + "').src != this.href) { document.getElementById('" + newaudioifid + "').src=this.href; this.href=this.href.replace('thebuttonwording=','thatbuttonwording='); } } } if (9 == 6) { setTimeout(function(){ document.getElementById('" + newaudioaid + "').target='_blank'; },100); }\" href=\"//www.rjmprogramming.com.au/HTMLCSS/karaoke_youtube_api.htm?youtubeid=" + theytcode + "&theaid=" + newaudioaid + "&theiframeid=" + newaudioifid + "&thebuttonwording=" + encodeURIComponent(thisaudioih.replace(/\'/g,'`') + audioemoji.replace('<sup','<sup id="sup' + newaudioaid + '_' + newaudioifid + '" ')) + "&justaJUNKudio=&youtube_duration=22223.000&email=&emoji=on&c0=on&i0=" + spos + "&j0=" + altend + "&i1=&j1=&i2=&j2=&i3=&j3=&i4=&j4=&i5=&j5=&i6=&j6=&i7=&j7=&i8=&j8=&i9=&j9=&i10=&j10=&i11=&j11=&i12=&j12=&i13=&j13=&i14=&j14=&i15=&j15=&i16=&j16=&i17=&j17=&i18=&j18=&i19=&j19=&i20=&j20=&i21=&j21=&i22=&j22=&i23=&j23=&i24=&j24=&i25=&j25=&i26=&j26=&i27=&j27=&i28=&j28=&i29=&j29=\" rel=\"noopener\">" + thisaudioih + "</a><div id=idivf" + newaudioaid + " style=display:inline-block;><iframe onload=\"if (navigator.userAgent.match(/Android|BlackBerry|iPhone|iPad|iPod|Opera Mini|IEMobile/i)) { document.getElementById('" + newaudioaid + "').target='" + newaudioifid + "';   if (this.src.indexOf('About_Us.') != -1) { document.getElementById('" + newaudioaid + "').target='" + newaudioifid + "'; this.src=document.getElementById('" + newaudioaid + "').href + '&rand=' + Math.floor(Math.random() * 1989786);  document.getElementById('" + newaudioaid + "').title+=' ';  } } \" id=" + newaudioifid + " name=" + newaudioifid + " src='//www.rjmprogramming.com.au/HTMLCSS/karaoke_youtube_api.htm?youtubeid=" + theytcode + "&theaid=" + newaudioaid + "&theiframeid=" + newaudioifid + "&thebuttonwording=" + encodeURIComponent(thisaudioih.replace(/\'/g,'`') + audioemoji.replace('<sup','<sup id="sup' + newaudioaid + '_' + newaudioifid + '" ')) + "&justaJUNKudio=&youtube_duration=22223.000&email=&emoji=on&c0=off&i0=" + spos + "&j0=" + altend + "&i1=&j1=&i2=&j2=&i3=&j3=&i4=&j4=&i5=&j5=&i6=&j6=&i7=&j7=&i8=&j8=&i9=&j9=&i10=&j10=&i11=&j11=&i12=&j12=&i13=&j13=&i14=&j14=&i15=&j15=&i16=&j16=&i17=&j17=&i18=&j18=&i19=&j19=&i20=&j20=&i21=&j21=&i22=&j22=&i23=&j23=&i24=&j24=&i25=&j25=&i26=&j26=&i27=&j27=&i28=&j28=&i29=&j29=' style=display:none;visibility:hidden;width:" + audioonlyas[iuhg].getBoundingClientRect().width + "px;height:" + audioonlyas[iuhg].getBoundingClientRect().height + "px;></iframe><div id='spn" + newaudioaid + "_" + newaudioifid + "' style=display:NONE;white-space:pre-line;> <br><textarea data-loop='' rows=4 data-mute='' data-val='' id='inp" + newaudioaid + "_" + newaudioifid + "' style=background-color:rgb(250,250,250);display:NONE;width:95%;font-size:8px;  data-loop='' data-mute='' data-val='' type=text onblur=ansis(event); placeholder='Audio control ... P=pause/play S=stop M=mute U=unmute L=loop ...' value=''></textarea></div><div style=display:inline-block; id='ldi" + newaudioaid + "'><!--input type=text style=position:absolute;top:-567px;left:-564px; value=''></input--></div></div>" + suffixout);

             } else {

             onefound=true;

             dbidea.innerHTML=dbidea.innerHTML.replace(audioonlyas[iuhg].outerHTML + suffixin, "<br><a data-pp='pause' data-ts=\"" + ('' + new Date()) + "\" data-it=\"" + encodeURIComponent(thisaudioit) + "\" data-at='0.0000' data-duration='22223.0000' oncontextmenu=\"window.open('//www.rjmprogramming.com.au/HTMLCSS/karaoke_youtube_api.htm?youtubeid=" + theytcode + "&theaNOid=" + newaudioaid + "&theifrNOameid=" + newaudioifid + "&thebuttoNOnwording=" + encodeURIComponent(thisaudioih.replace(/\'/g,'`') + audioemoji.replace('<sup','<sup id="sup' + newaudioaid + '_' + newaudioifid + '" ')) + "&justaJUNKudio=&youtube_duration=22223.000&email=&emoji=on&c0=on&i0=" + spos + "&j0=" + altend + "&i1=&j1=&i2=&j2=&i3=&j3=&i4=&j4=&i5=&j5=&i6=&j6=&i7=&j7=&i8=&j8=&i9=&j9=&i10=&j10=&i11=&j11=&i12=&j12=&i13=&j13=&i14=&j14=&i15=&j15=&i16=&j16=&i17=&j17=&i18=&j18=&i19=&j19=&i20=&j20=&i21=&j21=&i22=&j22=&i23=&j23=&i24=&j24=&i25=&j25=&i26=&j26=&i27=&j27=&i28=&j28=&i29=&j29=','_blank');\" class=processytplay id=\"" + newaudioaid + "\" target='" + newaudioifid + "\' title=\"" + thisaudiotitle + "\" data-onmouseover=\"if (!navigator.userAgent.match(/Android|BlackBerry|iPhone|iPad|iPod|Opera Mini|IEMobile/i)) {  this.title+=' ';  this.target='" + newaudioifid + "'; } \" onclick=\"if (!navigator.userAgent.match(/Android|BlackBerry|iPhone|iPad|iPod|Opera Mini|IEMobile/i) && this.title == this.title.trim()) {  document.getElementById('spn" + newaudioaid + "_" + newaudioifid + "').style.display='inline-block';   document.getElementById('inp" + newaudioaid + "_" + newaudioifid + "').style.display='inline-block';   if (okdclick) {  this.title+=' ';  this.target='" + newaudioifid + "';  if (document.getElementById('" + newaudioifid + "').src != this.href) { document.getElementById('" + newaudioifid + "').src=this.href; this.href=this.href.replace('thebuttonwording=','thatbuttonwording='); } } } if (9 == 6) { setTimeout(function(){ document.getElementById('" + newaudioaid + "').target='_blank'; },100); }\" href=\"//www.rjmprogramming.com.au/HTMLCSS/karaoke_youtube_api.htm?youtubeid=" + theytcode + "&theaid=" + newaudioaid + "&theiframeid=" + newaudioifid + "&thebuttonwording=" + encodeURIComponent(thisaudioih.replace(/\'/g,'`') + audioemoji.replace('<sup','<sup id="sup' + newaudioaid + '_' + newaudioifid + '" ')) + "&justaJUNKudio=&youtube_duration=22223.000&email=&emoji=on&c0=on&i0=" + spos + "&j0=" + altend + "&i1=&j1=&i2=&j2=&i3=&j3=&i4=&j4=&i5=&j5=&i6=&j6=&i7=&j7=&i8=&j8=&i9=&j9=&i10=&j10=&i11=&j11=&i12=&j12=&i13=&j13=&i14=&j14=&i15=&j15=&i16=&j16=&i17=&j17=&i18=&j18=&i19=&j19=&i20=&j20=&i21=&j21=&i22=&j22=&i23=&j23=&i24=&j24=&i25=&j25=&i26=&j26=&i27=&j27=&i28=&j28=&i29=&j29=\" rel=\"noopener\">" + thisaudioih + "</a><div id=idivf" + newaudioaid + " style=display:inline-block;><iframe onload=\"if (navigator.userAgent.match(/Android|BlackBerry|iPhone|iPad|iPod|Opera Mini|IEMobile/i)) { document.getElementById('" + newaudioaid + "').target='" + newaudioifid + "';   if (this.src.indexOf('About_Us.') != -1) { document.getElementById('" + newaudioaid + "').target='" + newaudioifid + "'; this.src=document.getElementById('" + newaudioaid + "').href + '&rand=' + Math.floor(Math.random() * 1989786);  document.getElementById('" + newaudioaid + "').title+=' ';  } } \" id=" + newaudioifid + " name=" + newaudioifid + " src='//www.rjmprogramming.com.au/HTMLCSS/karaoke_youtube_api.htm?youtubeid=" + theytcode + "&theaid=" + newaudioaid + "&theiframeid=" + newaudioifid + "&thebuttonwording=" + encodeURIComponent(thisaudioih.replace(/\'/g,'`') + audioemoji.replace('<sup','<sup id="sup' + newaudioaid + '_' + newaudioifid + '" ')) + "&justaJUNKudio=&youtube_duration=22223.000&email=&emoji=on&c0=off&i0=" + spos + "&j0=" + altend + "&i1=&j1=&i2=&j2=&i3=&j3=&i4=&j4=&i5=&j5=&i6=&j6=&i7=&j7=&i8=&j8=&i9=&j9=&i10=&j10=&i11=&j11=&i12=&j12=&i13=&j13=&i14=&j14=&i15=&j15=&i16=&j16=&i17=&j17=&i18=&j18=&i19=&j19=&i20=&j20=&i21=&j21=&i22=&j22=&i23=&j23=&i24=&j24=&i25=&j25=&i26=&j26=&i27=&j27=&i28=&j28=&i29=&j29=' style=display:none;visibility:hidden;width:" + audioonlyas[iuhg].getBoundingClientRect().width + "px;height:" + audioonlyas[iuhg].getBoundingClientRect().height + "px;></iframe><div id='spn" + newaudioaid + "_" + newaudioifid + "' style=display:NONE;white-space:pre-line;> <br><textarea data-loop='' rows=4 data-mute='' data-val='' id='inp" + newaudioaid + "_" + newaudioifid + "' style=background-color:rgb(250,250,250);display:NONE;width:95%;font-size:8px;  data-loop='' data-mute='' data-val='' type=text onblur=ansis(event); placeholder='Audio control ... P=pause/play S=stop M=mute U=unmute L=loop ...' value=''></textarea></div><div style=display:inline-block; id='ldi" + newaudioaid + "'><!--input type=text style=position:absolute;top:-567px;left:-564px; value=''></input--></div></div>" + suffixout);

             }

             if (dbidea.outerHTML.split('>')[0].indexOf('placeforvideo') != -1 || dbidea.outerHTML.split('>')[0].indexOf('areyousinging') != -1) {

               dbidea.style.visibility='visible';

             }

             }

             } else {

             if (navigator.userAgent.match(/Android|BlackBerry|iPhone|iPad|iPod|Opera Mini|IEMobile/i) || 1 == 11) {

             onoroff='on';

             if (!navigator.userAgent.match(/Android|BlackBerry|iPhone|iPad|iPod|Opera Mini|IEMobile/i)) {  onoroff='off'; }

  //setTimeout(function(){

             //document.body.innerHTML=curdbih.replace(thisaudiooh, "<a style=display:inline-block; class=processytplay id=\"" + newaudioaid + "\" target=\"_blank\" title=\"" + thisaudiotitle + "\" data-onmouseover=\"if (!navigator.userAgent.match(/Android|BlackBerry|iPhone|iPad|iPod|Opera Mini|IEMobile/i)) {  this.title+=' ';  this.target='" + newaudioifid + "'; } \" onclick=\"if (!navigator.userAgent.match(/Android|BlackBerry|iPhone|iPad|iPod|Opera Mini|IEMobile/i) && this.title == this.title.trim()) {  this.title+=' ';  this.target='" + newaudioifid + "';  if (2 == 2) { document.getElementById('" + newaudioifid + "').src=this.href; } } setTimeout(function(){ document.getElementById('" + newaudioaid + "').target='_blank'; },100);\" href=\"//www.rjmprogramming.com.au/HTMLCSS/karaoke_youtube_api.htm?youtubeid=" + theytcode + "&theaid=" + newaudioaid + "&theiframeid=" + newaudioifid + "&thebuttonwording=" + encodeURIComponent(thisaudioih) + "&justaJUNKudio=&youtube_duration=22223.000&email=&emoji=on&c0=on&i0=" + spos + "&j0=" + altend + "&i1=&j1=&i2=&j2=&i3=&j3=&i4=&j4=&i5=&j5=&i6=&j6=&i7=&j7=&i8=&j8=&i9=&j9=&i10=&j10=&i11=&j11=&i12=&j12=&i13=&j13=&i14=&j14=&i15=&j15=&i16=&j16=&i17=&j17=&i18=&j18=&i19=&j19=&i20=&j20=&i21=&j21=&i22=&j22=&i23=&j23=&i24=&j24=&i25=&j25=&i26=&j26=&i27=&j27=&i28=&j28=&i29=&j29=\" rel=\"noopener\">" + thisaudioih + "</a><iframe onload=\"if (navigator.userAgent.match(/Android|BlackBerry|iPhone|iPad|iPod|Opera Mini|IEMobile/i)) { document.getElementById('" + newaudioaid + "').target='" + newaudioifid + "';   if (this.src.indexOf('About_Us.') != -1) { document.getElementById('" + newaudioaid + "').target='" + newaudioifid + "'; this.src=document.getElementById('" + newaudioaid + "').href + '&rand=' + Math.floor(Math.random() * 1989786); } } \" id=" + newaudioifid + " name=" + newaudioifid + " src='//www.rjmprogramming.com.au/HTMLCSS/karaoke_youtube_api.htm?youtubeid=" + theytcode + "&theaid=" + newaudioaid + "&theiframeid=" + newaudioifid + "&thebuttonwording=" + encodeURIComponent(thisaudioih) + "&justaJUNKudio=&youtube_duration=22223.000&email=&emoji=on&c0=on&i0=" + spos + "&j0=" + altend + "&i1=&j1=&i2=&j2=&i3=&j3=&i4=&j4=&i5=&j5=&i6=&j6=&i7=&j7=&i8=&j8=&i9=&j9=&i10=&j10=&i11=&j11=&i12=&j12=&i13=&j13=&i14=&j14=&i15=&j15=&i16=&j16=&i17=&j17=&i18=&j18=&i19=&j19=&i20=&j20=&i21=&j21=&i22=&j22=&i23=&j23=&i24=&j24=&i25=&j25=&i26=&j26=&i27=&j27=&i28=&j28=&i29=&j29=' style=display:none;width:" + audioonlyas[iuhg].getBoundingClientRect().width + "px;></iframe>");

        //dbidea.innerHTML=curdbih.replace(thisaudiooh, "<a style=display:inline-block; class=processytplay id=\"" + newaudioaid + "\" target='" + newaudioifid + "\' title=\"" + thisaudiotitle + "\" data-onmouseover=\"if (!navigator.userAgent.match(/Android|BlackBerry|iPhone|iPad|iPod|Opera Mini|IEMobile/i)) {  this.title+=' ';  this.target='" + newaudioifid + "'; } \" onclick=\"if (!navigator.userAgent.match(/Android|BlackBerry|iPhone|iPad|iPod|Opera Mini|IEMobile/i) && this.title == this.title.trim()) {  this.title+=' ';  this.target='" + newaudioifid + "';  if (2 == 2) { document.getElementById('" + newaudioifid + "').src=this.href; } } setTimeout(function(){ document.getElementById('" + newaudioaid + "').target='_blank'; },100);\" href=\"//www.rjmprogramming.com.au/HTMLCSS/karaoke_youtube_api.htm?youtubeid=" + theytcode + "&theaid=" + newaudioaid + "&theiframeid=" + newaudioifid + "&thebuttonwording=" + encodeURIComponent(thisaudioih) + "&justaJUNKudio=&youtube_duration=22223.000&email=&emoji=on&c0=on&i0=" + spos + "&j0=" + altend + "&i1=&j1=&i2=&j2=&i3=&j3=&i4=&j4=&i5=&j5=&i6=&j6=&i7=&j7=&i8=&j8=&i9=&j9=&i10=&j10=&i11=&j11=&i12=&j12=&i13=&j13=&i14=&j14=&i15=&j15=&i16=&j16=&i17=&j17=&i18=&j18=&i19=&j19=&i20=&j20=&i21=&j21=&i22=&j22=&i23=&j23=&i24=&j24=&i25=&j25=&i26=&j26=&i27=&j27=&i28=&j28=&i29=&j29=\" rel=\"noopener\">" + thisaudioih + "</a><iframe onload=\"if (navigator.userAgent.match(/Android|BlackBerry|iPhone|iPad|iPod|Opera Mini|IEMobile/i)) { document.getElementById('" + newaudioaid + "').target='" + newaudioifid + "';   if (this.src.indexOf('About_Us.') != -1) { document.getElementById('" + newaudioaid + "').target='" + newaudioifid + "'; this.src=document.getElementById('" + newaudioaid + "').href + '&rand=' + Math.floor(Math.random() * 1989786); } } \" id=" + newaudioifid + " name=" + newaudioifid + " src='//www.rjmprogramming.com.au/HTMLCSS/karaoke_youtube_api.htm?youtubeid=" + theytcode + "&theaid=" + newaudioaid + "&theiframeid=" + newaudioifid + "&thebuttonwording=" + encodeURIComponent(thisaudioih) + "&justaJUNKudio=&youtube_duration=22223.000&email=&emoji=on&c0=on&i0=" + spos + "&j0=" + altend + "&i1=&j1=&i2=&j2=&i3=&j3=&i4=&j4=&i5=&j5=&i6=&j6=&i7=&j7=&i8=&j8=&i9=&j9=&i10=&j10=&i11=&j11=&i12=&j12=&i13=&j13=&i14=&j14=&i15=&j15=&i16=&j16=&i17=&j17=&i18=&j18=&i19=&j19=&i20=&j20=&i21=&j21=&i22=&j22=&i23=&j23=&i24=&j24=&i25=&j25=&i26=&j26=&i27=&j27=&i28=&j28=&i29=&j29=' style=display:none;width:" + audioonlyas[iuhg].getBoundingClientRect().width + "px;></iframe>");

             ////dbidea.innerHTML=curdbih.replace(thisaudiooh, "<div style=display:inline-block; class=processytplay id=\"" + newaudioaid + "\" data-target='" + newaudioifid + "\' data-title=\"" + thisaudiotitle + "\" data-onmouseover=\"if (!navigator.userAgent.match(/Android|BlackBerry|iPhone|iPad|iPod|Opera Mini|IEMobile/i)) {  this.title+=' ';  this.target='" + newaudioifid + "'; } \" onclick=\"if (!navigator.userAgent.match(/Android|BlackBerry|iPhone|iPad|iPod|Opera Mini|IEMobile/i) && this.title == this.title.trim()) {  this.title+=' ';  this.target='" + newaudioifid + "';  if (2 == 2) { document.getElementById('" + newaudioifid + "').src=this.title; } } setTimeout(function(){ document.getElementById('" + newaudioaid + "').target='_blank'; },100);\" title=\"//www.rjmprogramming.com.au/HTMLCSS/karaoke_youtube_api.htm?youtubeid=" + theytcode + "&theaid=" + newaudioaid + "&theiframeid=" + newaudioifid + "&thebuttonwording=" + encodeURIComponent(thisaudioih) + "&justaJUNKudio=&youtube_duration=22223.000&email=&emoji=on&c0=on&i0=" + spos + "&j0=" + altend + "&i1=&j1=&i2=&j2=&i3=&j3=&i4=&j4=&i5=&j5=&i6=&j6=&i7=&j7=&i8=&j8=&i9=&j9=&i10=&j10=&i11=&j11=&i12=&j12=&i13=&j13=&i14=&j14=&i15=&j15=&i16=&j16=&i17=&j17=&i18=&j18=&i19=&j19=&i20=&j20=&i21=&j21=&i22=&j22=&i23=&j23=&i24=&j24=&i25=&j25=&i26=&j26=&i27=&j27=&i28=&j28=&i29=&j29=\" rel=\"noopener\">" + thisaudioih + "</div><div id=idiJUNKvf><iframe onload=\"if (navigator.userAgent.match(/Android|BlackBerry|iPhone|iPad|iPod|Opera Mini|IEMobile/i)) { document.getElementById('" + newaudioaid + "').target='" + newaudioifid + "';   if (this.src.indexOf('About_Us.') != -1) { document.getElementById('" + newaudioaid + "').target='" + newaudioifid + "'; this.src=document.getElementById('" + newaudioaid + "').href + '&rand=' + Math.floor(Math.random() * 1989786); } } \" id=" + newaudioifid + " name=" + newaudioifid + " src='//www.rjmprogramming.com.au/HTMLCSS/karaoke_youtube_api.htm?youtubeid=" + theytcode + "&theaid=" + newaudioaid + "&theiframeid=" + newaudioifid + "&thebuttonwording=" + encodeURIComponent(thisaudioih) + "&justaJUNKudio=&youtube_duration=22223.000&email=&emoji=on&c0=on&i0=" + spos + "&j0=" + altend + "&i1=&j1=&i2=&j2=&i3=&j3=&i4=&j4=&i5=&j5=&i6=&j6=&i7=&j7=&i8=&j8=&i9=&j9=&i10=&j10=&i11=&j11=&i12=&j12=&i13=&j13=&i14=&j14=&i15=&j15=&i16=&j16=&i17=&j17=&i18=&j18=&i19=&j19=&i20=&j20=&i21=&j21=&i22=&j22=&i23=&j23=&i24=&j24=&i25=&j25=&i26=&j26=&i27=&j27=&i28=&j28=&i29=&j29=' style=display:none;width:" + audioonlyas[iuhg].getBoundingClientRect().width + "px;></iframe></div>");

console.warn('34 ' + curdbih.replace(thisaudiooh, "<div style=display:inline-block; class=processytplay id=\"" + newaudioaid + "\" data-target='" + newaudioifid + "\' data-title=\"" + thisaudiotitle + "\" data-onmouseover=\"if (!navigator.userAgent.match(/Android|BlackBerry|iPhone|iPad|iPod|Opera Mini|IEMobile/i)) {  this.title+=' ';  this.target='" + newaudioifid + "'; } \" onclick=\"if (!navigator.userAgent.match(/Android|BlackBerry|iPhone|iPad|iPod|Opera Mini|IEMobile/i) && this.title == this.title.trim()) {  this.title+=' ';  this.target='" + newaudioifid + "';  if (document.getElementById('" + newaudioifid + "').src != this.title.trim()) { document.getElementById('" + newaudioifid + "').src=this.title.trim(); } } if (9 == 6) { setTimeout(function(){ document.getElementById('" + newaudioaid + "').target='_blank'; },100); }\" title=\"//www.rjmprogramming.com.au/HTMLCSS/karaoke_youtube_api.htm?youtubeid=" + theytcode + "&theaid=" + newaudioaid + "&theiframeid=" + newaudioifid + "&thebuttonwording=" + encodeURIComponent(thisaudioih.replace(/\'/g,'`') + audioemoji.replace('<sup','<sup id="sup' + newaudioaid + '_' + newaudioifid + '" ')) + "&justaJUNKudio=&youtube_duration=22223.000&email=&emoji=on&c0=on&i0=" + spos + "&j0=" + altend + "&i1=&j1=&i2=&j2=&i3=&j3=&i4=&j4=&i5=&j5=&i6=&j6=&i7=&j7=&i8=&j8=&i9=&j9=&i10=&j10=&i11=&j11=&i12=&j12=&i13=&j13=&i14=&j14=&i15=&j15=&i16=&j16=&i17=&j17=&i18=&j18=&i19=&j19=&i20=&j20=&i21=&j21=&i22=&j22=&i23=&j23=&i24=&j24=&i25=&j25=&i26=&j26=&i27=&j27=&i28=&j28=&i29=&j29=\" rel=\"noopener\"><iframe title=\"" + thisaudioih + "\" onload=\"if (navigator.userAgent.match(/Android|BlackBerry|iPhone|iPad|iPod|Opera Mini|IEMobile/i)) { document.getElementById('" + newaudioaid + "').target='" + newaudioifid + "';   if (this.src.indexOf('About_Us.') != -1) { document.getElementById('" + newaudioaid + "').target='" + newaudioifid + "'; this.src=document.getElementById('" + newaudioaid + "').title + '&rand=' + Math.floor(Math.random() * 1989786); } } \" id=" + newaudioifid + " name=" + newaudioifid + " src='//www.rjmprogramming.com.au/HTMLCSS/karaoke_youtube_api.htm?youtubeid=" + theytcode + "&theaid=" + newaudioaid + "&theiframeid=" + newaudioifid + "&thebuttonwording=" + encodeURIComponent(thisaudioih.replace(/\'/g,'`') + audioemoji.replace('<sup','<sup id="sup' + newaudioaid + '_' + newaudioifid + '" ')) + "&justaJUNKudio=&youtube_duration=22223.000&email=&emoji=on&c0=on&i0=" + spos + "&j0=" + altend + "&i1=&j1=&i2=&j2=&i3=&j3=&i4=&j4=&i5=&j5=&i6=&j6=&i7=&j7=&i8=&j8=&i9=&j9=&i10=&j10=&i11=&j11=&i12=&j12=&i13=&j13=&i14=&j14=&i15=&j15=&i16=&j16=&i17=&j17=&i18=&j18=&i19=&j19=&i20=&j20=&i21=&j21=&i22=&j22=&i23=&j23=&i24=&j24=&i25=&j25=&i26=&j26=&i27=&j27=&i28=&j28=&i29=&j29=' style=display:none;width:" + audioonlyas[iuhg].getBoundingClientRect().width + "px;height:" + audioonlyas[iuhg].getBoundingClientRect().height + "px;></iframe><textarea rows=4 data-loop='' data-mute='' data-val='' id='inp" + newaudioaid + "_" + newaudioifid + "' style=background-color:rgb(250,250,250);display:NONE;width:95%;font-size:8px;; type=text onblur=ansis(event); placeholder='Audio control ... P=pause/play S=stop M=mute U=unmute L=loop ...'  value=''></textarea></div>" + suffixout));

//if (curdbih.indexOf(thisaudiooh) != -1) { alert(564); }

             // // //dbidea.innerHTML=curdbih.replace(thisaudiooh, "<div style=display:inline-block; class=processytplay id=\"" + newaudioaid + "\" data-target='" + newaudioifid + "\' data-title=\"" + thisaudiotitle + "\" data-onmouseover=\"if (!navigator.userAgent.match(/Android|BlackBerry|iPhone|iPad|iPod|Opera Mini|IEMobile/i)) {  this.title+=' ';  this.target='" + newaudioifid + "'; } \" onclick=\"if (!navigator.userAgent.match(/Android|BlackBerry|iPhone|iPad|iPod|Opera Mini|IEMobile/i) && this.title == this.title.trim()) {  this.title+=' ';  this.target='" + newaudioifid + "';  if (2 == 2) { document.getElementById('" + newaudioifid + "').src=this.title; } } setTimeout(function(){ document.getElementById('" + newaudioaid + "').target='_blank'; },100);\" title=\"//www.rjmprogramming.com.au/HTMLCSS/karaoke_youtube_api.htm?youtubeid=" + theytcode + "&theaid=" + newaudioaid + "&theiframeid=" + newaudioifid + "&thebuttonwording=" + encodeURIComponent(thisaudioih) + "&justaJUNKudio=&youtube_duration=22223.000&email=&emoji=on&c0=on&i0=" + spos + "&j0=" + altend + "&i1=&j1=&i2=&j2=&i3=&j3=&i4=&j4=&i5=&j5=&i6=&j6=&i7=&j7=&i8=&j8=&i9=&j9=&i10=&j10=&i11=&j11=&i12=&j12=&i13=&j13=&i14=&j14=&i15=&j15=&i16=&j16=&i17=&j17=&i18=&j18=&i19=&j19=&i20=&j20=&i21=&j21=&i22=&j22=&i23=&j23=&i24=&j24=&i25=&j25=&i26=&j26=&i27=&j27=&i28=&j28=&i29=&j29=\" rel=\"noopener\">" + thisaudioih + "</div><div id=idiJUNKvf><iframe onload=\"if (navigator.userAgent.match(/Android|BlackBerry|iPhone|iPad|iPod|Opera Mini|IEMobile/i)) { document.getElementById('" + newaudioaid + "').target='" + newaudioifid + "';   if (this.src.indexOf('About_Us.') != -1) { document.getElementById('" + newaudioaid + "').target='" + newaudioifid + "'; this.src=document.getElementById('" + newaudioaid + "').title + '&rand=' + Math.floor(Math.random() * 1989786); } } \" id=" + newaudioifid + " name=" + newaudioifid + " src='/About_Us.html' style=display:none;width:" + audioonlyas[iuhg].getBoundingClientRect().width + "px;></iframe></div>");

             // dbidea.innerHTML=curdbih.replace(thisaudiooh, "<div style=display:inline-block; class=processytplay id=\"" + newaudioaid + "\" data-target='" + newaudioifid + "\' data-title=\"" + thisaudiotitle + "\" data-onmouseover=\"if (!navigator.userAgent.match(/Android|BlackBerry|iPhone|iPad|iPod|Opera Mini|IEMobile/i)) {  this.title+=' ';   } \" onclick=\"if (!navigator.userAgent.match(/Android|BlackBerry|iPhone|iPad|iPod|Opera Mini|IEMobile/i) && this.title == this.title.trim()) {  this.title+=' ';   if (2 == 2) { document.getElementById('" + newaudioifid + "').src=this.title.trim(); } } \" title=\"//www.rjmprogramming.com.au/HTMLCSS/karaoke_youtube_api.htm?youtubeid=" + theytcode + "&theaid=" + newaudioaid + "&theiframeid=" + newaudioifid + "&thebuttonwording=" + encodeURIComponent(thisaudioih) + "&justaudio=&youtube_duration=22223.000&email=&emoji=on&c0=on&i0=" + spos + "&j0=" + altend + "&i1=&j1=&i2=&j2=&i3=&j3=&i4=&j4=&i5=&j5=&i6=&j6=&i7=&j7=&i8=&j8=&i9=&j9=&i10=&j10=&i11=&j11=&i12=&j12=&i13=&j13=&i14=&j14=&i15=&j15=&i16=&j16=&i17=&j17=&i18=&j18=&i19=&j19=&i20=&j20=&i21=&j21=&i22=&j22=&i23=&j23=&i24=&j24=&i25=&j25=&i26=&j26=&i27=&j27=&i28=&j28=&i29=&j29=\" rel=\"noopener\"><iframe onload=\"if (navigator.userAgent.match(/Android|BlackBerry|iPhone|iPad|iPod|Opera Mini|IEMobile/i)) {   if (this.src.indexOf('About_Us.') != -1) {  this.src=document.getElementById('" + newaudioaid + "').title.trim() + '&rand=' + Math.floor(Math.random() * 1989786); } } \" id=" + newaudioifid + " name=" + newaudioifid + " src='//www.rjmprogramming.com.au/HTMLCSS/karaoke_youtube_api.htm?youtubeid=" + theytcode + "&theaid=" + newaudioaid + "&theiframeid=" + newaudioifid + "&thebuttonwording=" + encodeURIComponent(thisaudioih) + "&justaudio=&youtube_duration=22223.000&email=&emoji=on&c0=on&i0=" + spos + "&j0=" + altend + "&i1=&j1=&i2=&j2=&i3=&j3=&i4=&j4=&i5=&j5=&i6=&j6=&i7=&j7=&i8=&j8=&i9=&j9=&i10=&j10=&i11=&j11=&i12=&j12=&i13=&j13=&i14=&j14=&i15=&j15=&i16=&j16=&i17=&j17=&i18=&j18=&i19=&j19=&i20=&j20=&i21=&j21=&i22=&j22=&i23=&j23=&i24=&j24=&i25=&j25=&i26=&j26=&i27=&j27=&i28=&j28=&i29=&j29=' style=display:inline-block;width:" + audioonlyas[iuhg].getBoundingClientRect().width + "px;></iframe></div>");

 //     alert(23);

             //sscidea=decodeURIComponent(('' + window.sessionStorage.getItem('_words_' + window.btoa(thisaudioit))).replace(/^null/g,'').replace(/^undefined/g,''));

 //     alert(263);

             //if (sscidea != '') {

 //     alert(423);

             //dbidea.innerHTML=curdbih.replace(thisaudiooh, sscidea);

 //     alert(1223);

             //} else {

 //      alert(823);

            //window.sessionStorage.setItem('_words_' + window.btoa(thisaudioit), encodeURIComponent("<!--div style=display:inline-block; class=processytplay id=\"" + newaudioaid + "\" data-target='" + newaudioifid + "\' data-title=\"" + thisaudiotitle + "\" data-onmouseover=\"if (!navigator.userAgent.match(/Android|BlackBerry|iPhone|iPad|iPod|Opera Mini|IEMobile/i)) {  this.title+=' ';   } \" onclick=\"if (!navigator.userAgent.match(/Android|BlackBerry|iPhone|iPad|iPod|Opera Mini|IEMobile/i) && this.title == this.title.trim()) {  this.title+=' ';   if (document.getElementById('" + newaudioifid + "').src != this.title.trim()) { document.getElementById('" + newaudioifid + "').src=this.title.trim(); } } \" title=\"//www.rjmprogramming.com.au/HTMLCSS/karaoke_youtube_api.htm?youtubeid=" + theytcode + "&theaid=" + newaudioaid + "&theiframeid=" + newaudioifid + "&thebuttonwording=" + encodeURIComponent(thisaudioih) + "&justaudio=&youtube_duration=22223.000&email=&emoji=on&c0=on&i0=" + spos + "&j0=" + altend + "&i1=&j1=&i2=&j2=&i3=&j3=&i4=&j4=&i5=&j5=&i6=&j6=&i7=&j7=&i8=&j8=&i9=&j9=&i10=&j10=&i11=&j11=&i12=&j12=&i13=&j13=&i14=&j14=&i15=&j15=&i16=&j16=&i17=&j17=&i18=&j18=&i19=&j19=&i20=&j20=&i21=&j21=&i22=&j22=&i23=&j23=&i24=&j24=&i25=&j25=&i26=&j26=&i27=&j27=&i28=&j28=&i29=&j29=\" rel=\"noopener\"--><iframe data-onload=\"if (navigator.userAgent.match(/Android|BlackBerry|iPhone|iPad|iPod|Opera Mini|IEMobile/i)) {    if (this.src.indexOf('About_Us.') != -1) {  this.src=document.getElementById('" + newaudioaid + "').title.trim() + '&rand=' + Math.floor(Math.random() * 1989786); } } \" id=" + newaudioifid + " name=" + newaudioifid + " src='//www.rjmprogramming.com.au/HTMLCSS/karaoke_youtube_api.htm?youtubeid=" + theytcode + "&theaid=" + newaudioaid + "&theiframeid=" + newaudioifid + "&thebuttonwording=" + encodeURIComponent(thisaudioih) + "&justaudio=&youtube_duration=22223.000&email=&emoji=on&c0=on&i0=" + spos + "&j0=" + altend + "&i1=&j1=&i2=&j2=&i3=&j3=&i4=&j4=&i5=&j5=&i6=&j6=&i7=&j7=&i8=&j8=&i9=&j9=&i10=&j10=&i11=&j11=&i12=&j12=&i13=&j13=&i14=&j14=&i15=&j15=&i16=&j16=&i17=&j17=&i18=&j18=&i19=&j19=&i20=&j20=&i21=&j21=&i22=&j22=&i23=&j23=&i24=&j24=&i25=&j25=&i26=&j26=&i27=&j27=&i28=&j28=&i29=&j29=' style=display:inline-block;width:" + audioonlyas[iuhg].getBoundingClientRect().width + "px;height:" + audioonlyas[iuhg].getBoundingClientRect().height + "px;></iframe><!--/div-->"));

 //     alert(923);

//             dbidea.innerHTML=curdbih.replace(thisaudiooh + suffixin, "<div data-pp='pause' data-ts=\"" + ('' + new Date()) + "\" data-it=\"" + encodeURIComponent(thisaudioit) + "\" data-at='0.0000' data-duration='22223.0000' ontouchstart=onmaybesupclick(event); onmousedown=onmaybesupclick(event); style=display:inline-block; class=processytplay id=\"" + newaudioaid + "\" data-target='" + newaudioifid + "\' data-title=\"" + thisaudiotitle + "\" data-onmouseover=\"if (!navigator.userAgent.match(/Android|BlackBerry|iPhone|iPad|iPod|Opera Mini|IEMobile/i)) {  this.title+=' ';   } \" onclick=\"if (!navigator.userAgent.match(/Android|BlackBerry|iPhone|iPad|iPod|Opera Mini|IEMobile/i) && this.title == this.title.trim()) {  document.getElementById('inp" + newaudioaid + "_" + newaudioifid + "').style.display='inline-block';   this.title+=' ';   if (document.getElementById('" + newaudioifid + "').src != this.title.trim()) { document.getElementById('" + newaudioifid + "').src=this.title.trim(); } } \" title=\"//www.rjmprogramming.com.au/HTMLCSS/karaoke_youtube_api.htm?youtubeid=" + theytcode + "&theaid=" + newaudioaid + "&theiframeid=" + newaudioifid + "&thebuttonwording=" + encodeURIComponent(thisaudioih.replace(/\'/g,'`') + audioemoji.replace('<sup','<sup id="sup' + newaudioaid + '_' + newaudioifid + '" ')) + "&justaJUNKudio=&youtube_duration=22223.000&email=&emoji=on&c0=on&i0=" + spos + "&j0=" + altend + "&i1=&j1=&i2=&j2=&i3=&j3=&i4=&j4=&i5=&j5=&i6=&j6=&i7=&j7=&i8=&j8=&i9=&j9=&i10=&j10=&i11=&j11=&i12=&j12=&i13=&j13=&i14=&j14=&i15=&j15=&i16=&j16=&i17=&j17=&i18=&j18=&i19=&j19=&i20=&j20=&i21=&j21=&i22=&j22=&i23=&j23=&i24=&j24=&i25=&j25=&i26=&j26=&i27=&j27=&i28=&j28=&i29=&j29=\" rel=\"noopener\"><iframe onload=\"if (navigator.userAgent.match(/Android|BlackBerry|iPhone|iPad|iPod|Opera Mini|IEMobile/i)) {    if (this.src.replace('c0=off','About_Us.').indexOf('About_Us.') != -1) {  this.src=document.getElementById('" + newaudioaid + "').title.trim() + '&rand=' + Math.floor(Math.random() * 1989786);   } } \" id=" + newaudioifid + " name=" + newaudioifid + " src='//www.rjmprogramming.com.au/HTMLCSS/karaoke_youtube_api.htm?youtubeid=" + theytcode + "&theaid=" + newaudioaid + "&theiframeid=" + newaudioifid + "&thebuttonwording=" + encodeURIComponent(thisaudioih.replace(/\'/g,'`') + audioemoji.replace('<sup','<sup id="sup' + newaudioaid + '_' + newaudioifid + '" ')) + "&justaJUNKudio=&youtube_duration=22223.000&email=&emoji=on&c0=" + onoroff + "&i0=" + spos + "&j0=" + altend + "&i1=&j1=&i2=&j2=&i3=&j3=&i4=&j4=&i5=&j5=&i6=&j6=&i7=&j7=&i8=&j8=&i9=&j9=&i10=&j10=&i11=&j11=&i12=&j12=&i13=&j13=&i14=&j14=&i15=&j15=&i16=&j16=&i17=&j17=&i18=&j18=&i19=&j19=&i20=&j20=&i21=&j21=&i22=&j22=&i23=&j23=&i24=&j24=&i25=&j25=&i26=&j26=&i27=&j27=&i28=&j28=&i29=&j29=' style=display:inline-block;width:" + eval(4.2 * audioonlyas[iuhg].getBoundingClientRect().width) + "px;height:" + eval(1.2 * audioonlyas[iuhg].getBoundingClientRect().height) + "px;></iframe><textarea rows=3 data-loop='' data-val='' id='inp" + newaudioaid + "_" + newaudioifid + "' style=background-color:rgb(250,250,250);display:inline-block;width:95%;font-size:12px;; type=text onblur=ansis(event); placeholder='Audio control ... P=pause/play S=stop M=mute U=unmute L=loop ...' value=''></textarea><div style=display:inline-block; id='ldi" + newaudioaid + "'><!--input type=text style=position:absolute;top:-567px;left:-564px; value=''></input--></div></div>");

             if (dbidea.innerHTML == audioonlyas[iuhg].outerHTML) {

             onefound=true;

             dbidea.innerHTML=("<div data-pp='pause' data-ts=\"" + ('' + new Date()) + "\" data-it=\"" + encodeURIComponent(thisaudioit) + "\" data-at='0.0000' data-duration='22223.0000' ontouchstart=onmaybesupclick(event); onmousedown=onmaybesupclick(event); style=display:inline-block; class=processytplay id=\"" + newaudioaid + "\" data-target='" + newaudioifid + "\' data-title=\"" + thisaudiotitle + "\" data-onmouseover=\"if (!navigator.userAgent.match(/Android|BlackBerry|iPhone|iPad|iPod|Opera Mini|IEMobile/i)) {  this.title+=' ';   } \" onclick=\"if (!navigator.userAgent.match(/Android|BlackBerry|iPhone|iPad|iPod|Opera Mini|IEMobile/i) && this.title == this.title.trim()) {  document.getElementById('inp" + newaudioaid + "_" + newaudioifid + "').style.display='inline-block';   this.title+=' ';   if (document.getElementById('" + newaudioifid + "').src != this.title.trim()) { document.getElementById('" + newaudioifid + "').src=this.title.trim(); } } \" title=\"//www.rjmprogramming.com.au/HTMLCSS/karaoke_youtube_api.htm?youtubeid=" + theytcode + "&theaid=" + newaudioaid + "&theiframeid=" + newaudioifid + "&thebuttonwording=" + encodeURIComponent(thisaudioih.replace(/\'/g,'`') + audioemoji.replace('<sup','<sup id="sup' + newaudioaid + '_' + newaudioifid + '" ')) + "&justaJUNKudio=&youtube_duration=22223.000&email=&emoji=on&c0=on&i0=" + spos + "&j0=" + altend + "&i1=&j1=&i2=&j2=&i3=&j3=&i4=&j4=&i5=&j5=&i6=&j6=&i7=&j7=&i8=&j8=&i9=&j9=&i10=&j10=&i11=&j11=&i12=&j12=&i13=&j13=&i14=&j14=&i15=&j15=&i16=&j16=&i17=&j17=&i18=&j18=&i19=&j19=&i20=&j20=&i21=&j21=&i22=&j22=&i23=&j23=&i24=&j24=&i25=&j25=&i26=&j26=&i27=&j27=&i28=&j28=&i29=&j29=\" rel=\"noopener\"><iframe onload=\"if (navigator.userAgent.match(/Android|BlackBerry|iPhone|iPad|iPod|Opera Mini|IEMobile/i)) {    if (this.src.replace('c0=off','About_Us.').indexOf('About_Us.') != -1) {  this.src=document.getElementById('" + newaudioaid + "').title.trim() + '&rand=' + Math.floor(Math.random() * 1989786);   } } \" id=" + newaudioifid + " name=" + newaudioifid + " src='//www.rjmprogramming.com.au/HTMLCSS/karaoke_youtube_api.htm?youtubeid=" + theytcode + "&theaid=" + newaudioaid + "&theiframeid=" + newaudioifid + "&thebuttonwording=" + encodeURIComponent(thisaudioih.replace(/\'/g,'`') + audioemoji.replace('<sup','<sup id="sup' + newaudioaid + '_' + newaudioifid + '" ')) + "&justaJUNKudio=&youtube_duration=22223.000&email=&emoji=on&c0=" + onoroff + "&i0=" + spos + "&j0=" + altend + "&i1=&j1=&i2=&j2=&i3=&j3=&i4=&j4=&i5=&j5=&i6=&j6=&i7=&j7=&i8=&j8=&i9=&j9=&i10=&j10=&i11=&j11=&i12=&j12=&i13=&j13=&i14=&j14=&i15=&j15=&i16=&j16=&i17=&j17=&i18=&j18=&i19=&j19=&i20=&j20=&i21=&j21=&i22=&j22=&i23=&j23=&i24=&j24=&i25=&j25=&i26=&j26=&i27=&j27=&i28=&j28=&i29=&j29=' style=display:inline-block;width:" + eval(4.2 * audioonlyas[iuhg].getBoundingClientRect().width) + "px;height:" + eval(1.2 * audioonlyas[iuhg].getBoundingClientRect().height) + "px;></iframe><textarea rows=3 data-loop='' data-mute='' data-val='' id='inp" + newaudioaid + "_" + newaudioifid + "' style=background-color:rgb(250,250,250);display:inline-block;width:95%;font-size:12px;; type=text onblur=ansis(event); placeholder='Audio control ... P=pause/play S=stop M=mute U=unmute L=loop ...' value=''></textarea><div style=display:inline-block; id='ldi" + newaudioaid + "'><!--input type=text style=position:absolute;top:-567px;left:-564px; value=''></input--></div></div>");

             } else {

             onefound=true;

             dbidea.innerHTML=dbidea.innerHTML.replace(audioonlyas[iuhg].outerHTML + suffixin, "<div data-pp='pause' data-ts=\"" + ('' + new Date()) + "\" data-it=\"" + encodeURIComponent(thisaudioit) + "\" data-at='0.0000' data-duration='22223.0000' ontouchstart=onmaybesupclick(event); onmousedown=onmaybesupclick(event); style=display:inline-block; class=processytplay id=\"" + newaudioaid + "\" data-target='" + newaudioifid + "\' data-title=\"" + thisaudiotitle + "\" data-onmouseover=\"if (!navigator.userAgent.match(/Android|BlackBerry|iPhone|iPad|iPod|Opera Mini|IEMobile/i)) {  this.title+=' ';   } \" onclick=\"if (!navigator.userAgent.match(/Android|BlackBerry|iPhone|iPad|iPod|Opera Mini|IEMobile/i) && this.title == this.title.trim()) {  document.getElementById('inp" + newaudioaid + "_" + newaudioifid + "').style.display='inline-block';   this.title+=' ';   if (document.getElementById('" + newaudioifid + "').src != this.title.trim()) { document.getElementById('" + newaudioifid + "').src=this.title.trim(); } } \" title=\"//www.rjmprogramming.com.au/HTMLCSS/karaoke_youtube_api.htm?youtubeid=" + theytcode + "&theaid=" + newaudioaid + "&theiframeid=" + newaudioifid + "&thebuttonwording=" + encodeURIComponent(thisaudioih.replace(/\'/g,'`') + audioemoji.replace('<sup','<sup id="sup' + newaudioaid + '_' + newaudioifid + '" ')) + "&justaJUNKudio=&youtube_duration=22223.000&email=&emoji=on&c0=on&i0=" + spos + "&j0=" + altend + "&i1=&j1=&i2=&j2=&i3=&j3=&i4=&j4=&i5=&j5=&i6=&j6=&i7=&j7=&i8=&j8=&i9=&j9=&i10=&j10=&i11=&j11=&i12=&j12=&i13=&j13=&i14=&j14=&i15=&j15=&i16=&j16=&i17=&j17=&i18=&j18=&i19=&j19=&i20=&j20=&i21=&j21=&i22=&j22=&i23=&j23=&i24=&j24=&i25=&j25=&i26=&j26=&i27=&j27=&i28=&j28=&i29=&j29=\" rel=\"noopener\"><iframe onload=\"if (navigator.userAgent.match(/Android|BlackBerry|iPhone|iPad|iPod|Opera Mini|IEMobile/i)) {    if (this.src.replace('c0=off','About_Us.').indexOf('About_Us.') != -1) {  this.src=document.getElementById('" + newaudioaid + "').title.trim() + '&rand=' + Math.floor(Math.random() * 1989786);   } } \" id=" + newaudioifid + " name=" + newaudioifid + " src='//www.rjmprogramming.com.au/HTMLCSS/karaoke_youtube_api.htm?youtubeid=" + theytcode + "&theaid=" + newaudioaid + "&theiframeid=" + newaudioifid + "&thebuttonwording=" + encodeURIComponent(thisaudioih.replace(/\'/g,'`') + audioemoji.replace('<sup','<sup id="sup' + newaudioaid + '_' + newaudioifid + '" ')) + "&justaJUNKudio=&youtube_duration=22223.000&email=&emoji=on&c0=" + onoroff + "&i0=" + spos + "&j0=" + altend + "&i1=&j1=&i2=&j2=&i3=&j3=&i4=&j4=&i5=&j5=&i6=&j6=&i7=&j7=&i8=&j8=&i9=&j9=&i10=&j10=&i11=&j11=&i12=&j12=&i13=&j13=&i14=&j14=&i15=&j15=&i16=&j16=&i17=&j17=&i18=&j18=&i19=&j19=&i20=&j20=&i21=&j21=&i22=&j22=&i23=&j23=&i24=&j24=&i25=&j25=&i26=&j26=&i27=&j27=&i28=&j28=&i29=&j29=' style=display:inline-block;width:" + eval(4.2 * audioonlyas[iuhg].getBoundingClientRect().width) + "px;height:" + eval(1.2 * audioonlyas[iuhg].getBoundingClientRect().height) + "px;></iframe><textarea rows=3 data-loop='' data-mute='' data-val='' id='inp" + newaudioaid + "_" + newaudioifid + "' style=background-color:rgb(250,250,250);display:inline-block;width:95%;font-size:12px;; type=text onblur=ansis(event); placeholder='Audio control ... P=pause/play S=stop M=mute U=unmute L=loop ...' value=''></textarea><div style=display:inline-block; id='ldi" + newaudioaid + "'><!--input type=text style=position:absolute;top:-567px;left:-564px; value=''></input--></div></div>");

             }

             if (dbidea.outerHTML.split('>')[0].indexOf('placeforvideo') != -1 || dbidea.outerHTML.split('>')[0].indexOf('areyousinging') != -1) {

               dbidea.style.visibility='visible';

             }

 //     alert(9823);

             //}

  //}, 8000);

             } else {

             //document.body.innerHTML=curdbih.replace(thisaudiooh, "<a class=processytplay id=\"" + newaudioaid + "\" target='" + newaudioifid + "\' title=\"" + thisaudiotitle + "\" onmouseover=\"if (!navigator.userAgent.match(/Android|BlackBerry|iPhone|iPad|iPod|Opera Mini|IEMobile/i)) {  this.title+=' ';  this.target='" + newaudioifid + "'; } \" onclick=\"if (!navigator.userAgent.match(/Android|BlackBerry|iPhone|iPad|iPod|Opera Mini|IEMobile/i) && this.title == this.title.trim()) {  this.title+=' ';  this.target='" + newaudioifid + "';  document.getElementById('" + newaudioifid + "').src=this.href; } setTimeout(function(){ document.getElementById('" + newaudioaid + "').target='_blank'; },100);\" href=\"//www.rjmprogramming.com.au/HTMLCSS/karaoke_youtube_api.htm?youtubeid=" + theytcode + "&theaid=" + newaudioaid + "&theiframeid=" + newaudioifid + "&thebuttonwording=" + encodeURIComponent(thisaudioih) + "&justaJUNKudio=&youtube_duration=22223.000&email=&emoji=on&c0=on&i0=" + spos + "&j0=" + altend + "&i1=&j1=&i2=&j2=&i3=&j3=&i4=&j4=&i5=&j5=&i6=&j6=&i7=&j7=&i8=&j8=&i9=&j9=&i10=&j10=&i11=&j11=&i12=&j12=&i13=&j13=&i14=&j14=&i15=&j15=&i16=&j16=&i17=&j17=&i18=&j18=&i19=&j19=&i20=&j20=&i21=&j21=&i22=&j22=&i23=&j23=&i24=&j24=&i25=&j25=&i26=&j26=&i27=&j27=&i28=&j28=&i29=&j29=\" rel=\"noopener\">" + thisaudioih + "</a><div id=idivf><iframe onload=\"if (navigator.userAgent.match(/Android|BlackBerry|iPhone|iPad|iPod|Opera Mini|IEMobile/i)) { document.getElementById('" + newaudioaid + "').target='" + newaudioifid + "';   if (this.src.indexOf('About_Us.') != -1) { document.getElementById('" + newaudioaid + "').target='" + newaudioifid + "'; this.src=document.getElementById('" + newaudioaid + "').href + '&rand=' + Math.floor(Math.random() * 1989786); } } \" id=" + newaudioifid + " name=" + newaudioifid + " src='/About_Us.html' style=display:none;></iframe></div>");

//alert(198);

             // // dbidea.innerHTML=curdbih.replace(thisaudiooh, "<a class=processytplay id=\"" + newaudioaid + "\" target='" + newaudioifid + "\' title=\"" + thisaudiotitle + "\" data-onmouseover=\"if (!navigator.userAgent.match(/Android|BlackBerry|iPhone|iPad|iPod|Opera Mini|IEMobile/i)) {  this.title+=' ';  this.target='" + newaudioifid + "'; } \" onclick=\"if (!navigator.userAgent.match(/Android|BlackBerry|iPhone|iPad|iPod|Opera Mini|IEMobile/i) && this.title == this.title.trim()) {  this.title+=' ';  this.target='" + newaudioifid + "';  if (document.getElementById('" + newaudioifid + "').src != this.href) { document.getElementById('" + newaudioifid + "').src=this.href; } } if (9 == 6) { setTimeout(function(){ document.getElementById('" + newaudioaid + "').target='_blank';  },100); }\" href=\"//www.rjmprogramming.com.au/HTMLCSS/karaoke_youtube_api.htm?youtubeid=" + theytcode + "&theaid=" + newaudioaid + "&theiframeid=" + newaudioifid + "&thebuttonwording=" + encodeURIComponent(thisaudioih) + "&justaJUNKudio=&youtube_duration=22223.000&email=&emoji=on&c0=on&i0=" + spos + "&j0=" + altend + "&i1=&j1=&i2=&j2=&i3=&j3=&i4=&j4=&i5=&j5=&i6=&j6=&i7=&j7=&i8=&j8=&i9=&j9=&i10=&j10=&i11=&j11=&i12=&j12=&i13=&j13=&i14=&j14=&i15=&j15=&i16=&j16=&i17=&j17=&i18=&j18=&i19=&j19=&i20=&j20=&i21=&j21=&i22=&j22=&i23=&j23=&i24=&j24=&i25=&j25=&i26=&j26=&i27=&j27=&i28=&j28=&i29=&j29=\" rel=\"noopener\">" + thisaudioih + "</a><div id=idivf><iframe onload=\"if (navigator.userAgent.match(/Android|BlackBerry|iPhone|iPad|iPod|Opera Mini|IEMobile/i)) { document.getElementById('" + newaudioaid + "').target='" + newaudioifid + "';   if (this.src.indexOf('About_Us.') != -1) { document.getElementById('" + newaudioaid + "').target='" + newaudioifid + "'; this.src=document.getElementById('" + newaudioaid + "').href + '&rand=' + Math.floor(Math.random() * 1989786); } } \" id=" + newaudioifid + " name=" + newaudioifid + " src='//www.rjmprogramming.com.au/HTMLCSS/karaoke_youtube_api.htm?youtubeid=" + theytcode + "&theaid=" + newaudioaid + "&theiframeid=" + newaudioifid + "&thebuttonwording=" + encodeURIComponent(thisaudioih) + "&justaJUNKudio=&youtube_duration=22223.000&email=&emoji=on&c0=off&i0=" + spos + "&j0=" + altend + "&i1=&j1=&i2=&j2=&i3=&j3=&i4=&j4=&i5=&j5=&i6=&j6=&i7=&j7=&i8=&j8=&i9=&j9=&i10=&j10=&i11=&j11=&i12=&j12=&i13=&j13=&i14=&j14=&i15=&j15=&i16=&j16=&i17=&j17=&i18=&j18=&i19=&j19=&i20=&j20=&i21=&j21=&i22=&j22=&i23=&j23=&i24=&j24=&i25=&j25=&i26=&j26=&i27=&j27=&i28=&j28=&i29=&j29=' style=display:none;></iframe></div>");

//             dbidea.innerHTML=curdbih.replace(thisaudiooh + suffixin, "<a data-pp='pause' data-ts=\"" + ('' + new Date()) + "\" data-it=\"" + encodeURIComponent(thisaudioit) + "\" data-at='0.0000' data-duration='22223.0000' oncontextmenu=\"window.open('//www.rjmprogramming.com.au/HTMLCSS/karaoke_youtube_api.htm?youtubeid=" + theytcode + "&theNOaid=" + newaudioaid + "&theiframeNOid=" + newaudioifid + "&thebuttonNOwording=" + encodeURIComponent(thisaudioih.replace(/\'/g,'`') + audioemoji.replace('<sup','<sup id="sup' + newaudioaid + '_' + newaudioifid + '" ')) + "&justaJUNKudio=&youtube_duration=22223.000&email=&emoji=on&c0=on&i0=" + spos + "&j0=" + altend + "&i1=&j1=&i2=&j2=&i3=&j3=&i4=&j4=&i5=&j5=&i6=&j6=&i7=&j7=&i8=&j8=&i9=&j9=&i10=&j10=&i11=&j11=&i12=&j12=&i13=&j13=&i14=&j14=&i15=&j15=&i16=&j16=&i17=&j17=&i18=&j18=&i19=&j19=&i20=&j20=&i21=&j21=&i22=&j22=&i23=&j23=&i24=&j24=&i25=&j25=&i26=&j26=&i27=&j27=&i28=&j28=&i29=&j29=','_blank');\" class=processytplay id=\"" + newaudioaid + "\" target='" + newaudioifid + "\' title=\"" + thisaudiotitle + "\" data-onmouseover=\"if (!navigator.userAgent.match(/Android|BlackBerry|iPhone|iPad|iPod|Opera Mini|IEMobile/i)) {  this.title+=' ';  this.target='" + newaudioifid + "'; } \" onclick=\"if (!navigator.userAgent.match(/Android|BlackBerry|iPhone|iPad|iPod|Opera Mini|IEMobile/i) && this.title == this.title.trim()) {  document.getElementById('spn" + newaudioaid + "_" + newaudioifid + "').style.display='inline-block';  document.getElementById('inp" + newaudioaid + "_" + newaudioifid + "').style.display='inline-block';   if (okdclick) { this.title+=' ';  this.target='" + newaudioifid + "';  if (document.getElementById('" + newaudioifid + "').src != this.href) { document.getElementById('" + newaudioifid + "').src=this.href; this.href=this.href.replace('thebuttonwording=','thatbuttonwording=');  } } } if (9 == 6) { setTimeout(function(){ document.getElementById('" + newaudioaid + "').target='_blank'; },100); }\" href=\"//www.rjmprogramming.com.au/HTMLCSS/karaoke_youtube_api.htm?youtubeid=" + theytcode + "&theaid=" + newaudioaid + "&theiframeid=" + newaudioifid + "&thebuttonwording=" + encodeURIComponent(thisaudioih.replace(/\'/g,'`') + audioemoji.replace('<sup','<sup id="sup' + newaudioaid + '_' + newaudioifid + '" ')) + "&justaJUNKudio=&youtube_duration=22223.000&email=&emoji=on&c0=on&i0=" + spos + "&j0=" + altend + "&i1=&j1=&i2=&j2=&i3=&j3=&i4=&j4=&i5=&j5=&i6=&j6=&i7=&j7=&i8=&j8=&i9=&j9=&i10=&j10=&i11=&j11=&i12=&j12=&i13=&j13=&i14=&j14=&i15=&j15=&i16=&j16=&i17=&j17=&i18=&j18=&i19=&j19=&i20=&j20=&i21=&j21=&i22=&j22=&i23=&j23=&i24=&j24=&i25=&j25=&i26=&j26=&i27=&j27=&i28=&j28=&i29=&j29=\" rel=\"noopener\">" + thisaudioih + "</a><div id=idivf style=display:inline-block;><iframe onload=\"if (navigator.userAgent.match(/Android|BlackBerry|iPhone|iPad|iPod|Opera Mini|IEMobile/i)) {  document.getElementById('" + newaudioaid + "').target='" + newaudioifid + "';   if (this.src.indexOf('About_Us.') != -1) { document.getElementById('" + newaudioaid + "').target='" + newaudioifid + "'; this.src=document.getElementById('" + newaudioaid + "').href + '&rand=' + Math.floor(Math.random() * 1989786);   document.getElementById('" + newaudioaid + "').title+=' '; } } \" id=" + newaudioifid + " name=" + newaudioifid + " src='//www.rjmprogramming.com.au/HTMLCSS/karaoke_youtube_api.htm?youtubeid=" + theytcode + "&theaid=" + newaudioaid + "&theiframeid=" + newaudioifid + "&thebuttonwording=" + encodeURIComponent(thisaudioih.replace(/\'/g,'`') + audioemoji.replace('<sup','<sup id="sup' + newaudioaid + '_' + newaudioifid + '" ')) + "&justaJUNKudio=&youtube_duration=22223.000&email=&emoji=on&c0=off&i0=" + spos + "&j0=" + altend + "&i1=&j1=&i2=&j2=&i3=&j3=&i4=&j4=&i5=&j5=&i6=&j6=&i7=&j7=&i8=&j8=&i9=&j9=&i10=&j10=&i11=&j11=&i12=&j12=&i13=&j13=&i14=&j14=&i15=&j15=&i16=&j16=&i17=&j17=&i18=&j18=&i19=&j19=&i20=&j20=&i21=&j21=&i22=&j22=&i23=&j23=&i24=&j24=&i25=&j25=&i26=&j26=&i27=&j27=&i28=&j28=&i29=&j29=' style=display:none;visibility:hidden;width:" + audioonlyas[iuhg].getBoundingClientRect().width + "px;height:" + audioonlyas[iuhg].getBoundingClientRect().height + "px;></iframe><div id='spn" + newaudioaid + "_" + newaudioifid + "' style=display:NONE;white-space:pre-line;> <br><textarea rows=4 data-loop='' data-val='' id='inp" + newaudioaid + "_" + newaudioifid + "' style=background-color:rgb(250,250,250);display:NONE;width:95%;font-size:8px; type=text onblur=ansis(event); placeholder='Audio control ... P=pause/play S=stop M=mute U=unmute L=loop ...' value=''></textarea></div><div style=display:inline-block; id='ldi" + newaudioaid + "'><!--input type=text style=position:absolute;top:-567px;left:-564px; value=''></input--></div></div>" + suffixout);

             if (dbidea.innerHTML == audioonlyas[iuhg].outerHTML) {

             onefound=true;

             dbidea.innerHTML=("<a data-pp='pause' data-ts=\"" + ('' + new Date()) + "\" data-it=\"" + encodeURIComponent(thisaudioit) + "\" data-at='0.0000' data-duration='22223.0000' oncontextmenu=\"window.open('//www.rjmprogramming.com.au/HTMLCSS/karaoke_youtube_api.htm?youtubeid=" + theytcode + "&theNOaid=" + newaudioaid + "&theiframeNOid=" + newaudioifid + "&thebuttonNOwording=" + encodeURIComponent(thisaudioih.replace(/\'/g,'`') + audioemoji.replace('<sup','<sup id="sup' + newaudioaid + '_' + newaudioifid + '" ')) + "&justaJUNKudio=&youtube_duration=22223.000&email=&emoji=on&c0=on&i0=" + spos + "&j0=" + altend + "&i1=&j1=&i2=&j2=&i3=&j3=&i4=&j4=&i5=&j5=&i6=&j6=&i7=&j7=&i8=&j8=&i9=&j9=&i10=&j10=&i11=&j11=&i12=&j12=&i13=&j13=&i14=&j14=&i15=&j15=&i16=&j16=&i17=&j17=&i18=&j18=&i19=&j19=&i20=&j20=&i21=&j21=&i22=&j22=&i23=&j23=&i24=&j24=&i25=&j25=&i26=&j26=&i27=&j27=&i28=&j28=&i29=&j29=','_blank');\" class=processytplay id=\"" + newaudioaid + "\" target='" + newaudioifid + "\' title=\"" + thisaudiotitle + "\" data-onmouseover=\"if (!navigator.userAgent.match(/Android|BlackBerry|iPhone|iPad|iPod|Opera Mini|IEMobile/i)) {  this.title+=' ';  this.target='" + newaudioifid + "'; } \" onclick=\"if (!navigator.userAgent.match(/Android|BlackBerry|iPhone|iPad|iPod|Opera Mini|IEMobile/i) && this.title == this.title.trim()) {  document.getElementById('spn" + newaudioaid + "_" + newaudioifid + "').style.display='inline-block';  document.getElementById('inp" + newaudioaid + "_" + newaudioifid + "').style.display='inline-block';   if (okdclick) { this.title+=' ';  this.target='" + newaudioifid + "';  if (document.getElementById('" + newaudioifid + "').src != this.href) { document.getElementById('" + newaudioifid + "').src=this.href; this.href=this.href.replace('thebuttonwording=','thatbuttonwording=');  } } } if (9 == 6) { setTimeout(function(){ document.getElementById('" + newaudioaid + "').target='_blank'; },100); }\" href=\"//www.rjmprogramming.com.au/HTMLCSS/karaoke_youtube_api.htm?youtubeid=" + theytcode + "&theaid=" + newaudioaid + "&theiframeid=" + newaudioifid + "&thebuttonwording=" + encodeURIComponent(thisaudioih.replace(/\'/g,'`') + audioemoji.replace('<sup','<sup id="sup' + newaudioaid + '_' + newaudioifid + '" ')) + "&justaJUNKudio=&youtube_duration=22223.000&email=&emoji=on&c0=on&i0=" + spos + "&j0=" + altend + "&i1=&j1=&i2=&j2=&i3=&j3=&i4=&j4=&i5=&j5=&i6=&j6=&i7=&j7=&i8=&j8=&i9=&j9=&i10=&j10=&i11=&j11=&i12=&j12=&i13=&j13=&i14=&j14=&i15=&j15=&i16=&j16=&i17=&j17=&i18=&j18=&i19=&j19=&i20=&j20=&i21=&j21=&i22=&j22=&i23=&j23=&i24=&j24=&i25=&j25=&i26=&j26=&i27=&j27=&i28=&j28=&i29=&j29=\" rel=\"noopener\">" + thisaudioih + "</a><div id=idivf" + newaudioaid + " style=display:inline-block;><iframe onload=\"if (navigator.userAgent.match(/Android|BlackBerry|iPhone|iPad|iPod|Opera Mini|IEMobile/i)) {  document.getElementById('" + newaudioaid + "').target='" + newaudioifid + "';   if (this.src.indexOf('About_Us.') != -1) { document.getElementById('" + newaudioaid + "').target='" + newaudioifid + "'; this.src=document.getElementById('" + newaudioaid + "').href + '&rand=' + Math.floor(Math.random() * 1989786);   document.getElementById('" + newaudioaid + "').title+=' '; } } \" id=" + newaudioifid + " name=" + newaudioifid + " src='//www.rjmprogramming.com.au/HTMLCSS/karaoke_youtube_api.htm?youtubeid=" + theytcode + "&theaid=" + newaudioaid + "&theiframeid=" + newaudioifid + "&thebuttonwording=" + encodeURIComponent(thisaudioih.replace(/\'/g,'`') + audioemoji.replace('<sup','<sup id="sup' + newaudioaid + '_' + newaudioifid + '" ')) + "&justaJUNKudio=&youtube_duration=22223.000&email=&emoji=on&c0=off&i0=" + spos + "&j0=" + altend + "&i1=&j1=&i2=&j2=&i3=&j3=&i4=&j4=&i5=&j5=&i6=&j6=&i7=&j7=&i8=&j8=&i9=&j9=&i10=&j10=&i11=&j11=&i12=&j12=&i13=&j13=&i14=&j14=&i15=&j15=&i16=&j16=&i17=&j17=&i18=&j18=&i19=&j19=&i20=&j20=&i21=&j21=&i22=&j22=&i23=&j23=&i24=&j24=&i25=&j25=&i26=&j26=&i27=&j27=&i28=&j28=&i29=&j29=' style=display:none;visibility:hidden;width:" + audioonlyas[iuhg].getBoundingClientRect().width + "px;height:" + audioonlyas[iuhg].getBoundingClientRect().height + "px;></iframe><div id='spn" + newaudioaid + "_" + newaudioifid + "' style=display:NONE;white-space:pre-line;> <br><textarea rows=4 data-loop='' data-mute='' data-val='' id='inp" + newaudioaid + "_" + newaudioifid + "' style=background-color:rgb(250,250,250);display:NONE;width:95%;font-size:8px; type=text onblur=ansis(event); placeholder='Audio control ... P=pause/play S=stop M=mute U=unmute L=loop ...' value=''></textarea></div><div style=display:inline-block; id='ldi" + newaudioaid + "'><!--input type=text style=position:absolute;top:-567px;left:-564px; value=''></input--></div></div>" + suffixout);

             } else {

    // // // dbidea.innerHTML=dbidea.innerHTML.replace(audioonlyas[iuhg].outerHTML + suffixin, "<a data-pp='pause' data-ts=\"" + ('' + new Date()) + "\" data-it=\"" + encodeURIComponent(thisaudioit) + "\" data-at='0.0000' data-duration='22223.0000' oncontextmenu=\"window.open('//www.rjmprogramming.com.au/HTMLCSS/karaoke_youtube_api.htm?youtubeid=" + theytcode + "&theNOaid=" + newaudioaid + "&theiframeNOid=" + newaudioifid + "&thebuttonNOwording=" + encodeURIComponent(thisaudioih.replace(/\'/g,'`') + audioemoji.replace('<sup','<sup id="sup' + newaudioaid + '_' + newaudioifid + '" ')) + "&justaJUNKudio=&youtube_duration=22223.000&email=&emoji=on&c0=on&i0=" + spos + "&j0=" + altend + "&i1=&j1=&i2=&j2=&i3=&j3=&i4=&j4=&i5=&j5=&i6=&j6=&i7=&j7=&i8=&j8=&i9=&j9=&i10=&j10=&i11=&j11=&i12=&j12=&i13=&j13=&i14=&j14=&i15=&j15=&i16=&j16=&i17=&j17=&i18=&j18=&i19=&j19=&i20=&j20=&i21=&j21=&i22=&j22=&i23=&j23=&i24=&j24=&i25=&j25=&i26=&j26=&i27=&j27=&i28=&j28=&i29=&j29=','_blank');\" class=processytplay id=\"" + newaudioaid + "\" target='" + newaudioifid + "\' title=\"" + thisaudiotitle + "\" data-onmouseover=\"if (!navigator.userAgent.match(/Android|BlackBerry|iPhone|iPad|iPod|Opera Mini|IEMobile/i)) {  this.title+=' ';  this.target='" + newaudioifid + "'; } \" onclick=\"if (!navigator.userAgent.match(/Android|BlackBerry|iPhone|iPad|iPod|Opera Mini|IEMobile/i) && this.title == this.title.trim()) {  document.getElementById('spn" + newaudioaid + "_" + newaudioifid + "').style.display='inline-block';  document.getElementById('inp" + newaudioaid + "_" + newaudioifid + "').style.display='inline-block';   if (okdclick) { this.title+=' ';  this.target='" + newaudioifid + "';  if (document.getElementById('" + newaudioifid + "').src != this.href) { document.getElementById('" + newaudioifid + "').src=this.href; this.href=this.href.replace('thebuttonwording=','thatbuttonwording=');  } } } if (9 == 6) { setTimeout(function(){ document.getElementById('" + newaudioaid + "').target='_blank'; },100); }\" href=\"//www.rjmprogramming.com.au/HTMLCSS/karaoke_youtube_api.htm?youtubeid=" + theytcode + "&theaid=" + newaudioaid + "&theiframeid=" + newaudioifid + "&thebuttonwording=" + encodeURIComponent(thisaudioih.replace(/\'/g,'`') + audioemoji.replace('<sup','<sup id="sup' + newaudioaid + '_' + newaudioifid + '" ')) + "&justaJUNKudio=&youtube_duration=22223.000&email=&emoji=on&c0=on&i0=" + spos + "&j0=" + altend + "&i1=&j1=&i2=&j2=&i3=&j3=&i4=&j4=&i5=&j5=&i6=&j6=&i7=&j7=&i8=&j8=&i9=&j9=&i10=&j10=&i11=&j11=&i12=&j12=&i13=&j13=&i14=&j14=&i15=&j15=&i16=&j16=&i17=&j17=&i18=&j18=&i19=&j19=&i20=&j20=&i21=&j21=&i22=&j22=&i23=&j23=&i24=&j24=&i25=&j25=&i26=&j26=&i27=&j27=&i28=&j28=&i29=&j29=\" rel=\"noopener\">" + thisaudioih + "</a><div id=idivf" + newaudioaid + " style=display:inline-block;><iframe onload=\"if (navigator.userAgent.match(/Android|BlackBerry|iPhone|iPad|iPod|Opera Mini|IEMobile/i)) {  document.getElementById('" + newaudioaid + "').target='" + newaudioifid + "';   if (this.src.indexOf('About_Us.') != -1) { document.getElementById('" + newaudioaid + "').target='" + newaudioifid + "'; this.src=document.getElementById('" + newaudioaid + "').href + '&rand=' + Math.floor(Math.random() * 1989786);   document.getElementById('" + newaudioaid + "').title+=' '; } } \" id=" + newaudioifid + " name=" + newaudioifid + " src='//www.rjmprogramming.com.au/HTMLCSS/karaoke_youtube_api.htm?youtubeid=" + theytcode + "&theaid=" + newaudioaid + "&theiframeid=" + newaudioifid + "&thebuttonwording=" + encodeURIComponent(thisaudioih.replace(/\'/g,'`') + audioemoji.replace('<sup','<sup id="sup' + newaudioaid + '_' + newaudioifid + '" ')) + "&justaJUNKudio=&youtube_duration=22223.000&email=&emoji=on&c0=off&i0=" + spos + "&j0=" + altend + "&i1=&j1=&i2=&j2=&i3=&j3=&i4=&j4=&i5=&j5=&i6=&j6=&i7=&j7=&i8=&j8=&i9=&j9=&i10=&j10=&i11=&j11=&i12=&j12=&i13=&j13=&i14=&j14=&i15=&j15=&i16=&j16=&i17=&j17=&i18=&j18=&i19=&j19=&i20=&j20=&i21=&j21=&i22=&j22=&i23=&j23=&i24=&j24=&i25=&j25=&i26=&j26=&i27=&j27=&i28=&j28=&i29=&j29=' style=display:none;visibility:hidden;width:" + audioonlyas[iuhg].getBoundingClientRect().width + "px;height:" + audioonlyas[iuhg].getBoundingClientRect().height + "px;></iframe><div id='spn" + newaudioaid + "_" + newaudioifid + "' style=display:NONE;white-space:pre-line;> <br><textarea rows=4 data-loop='' data-mute='' data-val='' id='inp" + newaudioaid + "_" + newaudioifid + "' style=background-color:rgb(250,250,250);display:NONE;width:95%;font-size:8px; type=text onblur=ansis(event); placeholder='Audio control ... P=pause/play S=stop M=mute U=unmute L=loop ...' value=''></textarea></div><div style=display:inline-block; id='ldi" + newaudioaid + "'><!--input type=text style=position:absolute;top:-567px;left:-564px; value=''></input--></div></div>" + suffixout);

             onefound=true;

             dbidea.innerHTML=dbidea.innerHTML.replace(audioonlyas[iuhg].outerHTML + suffixin, "<a data-pp='pause' data-ts=\"" + ('' + new Date()) + "\" data-it=\"" + encodeURIComponent(thisaudioit) + "\" data-at='0.0000' data-duration='22223.0000' oncontextmenu=\"window.open('//www.rjmprogramming.com.au/HTMLCSS/karaoke_youtube_api.htm?youtubeid=" + theytcode + "&theaNOid=" + newaudioaid + "&theifrNOameid=" + newaudioifid + "&thebuttoNOnwording=" + encodeURIComponent(thisaudioih.replace(/\'/g,'`') + audioemoji.replace('<sup','<sup id="sup' + newaudioaid + '_' + newaudioifid + '" ')) + "&justaJUNKudio=&youtube_duration=22223.000&email=&emoji=on&c0=on&i0=" + spos + "&j0=" + altend + "&i1=&j1=&i2=&j2=&i3=&j3=&i4=&j4=&i5=&j5=&i6=&j6=&i7=&j7=&i8=&j8=&i9=&j9=&i10=&j10=&i11=&j11=&i12=&j12=&i13=&j13=&i14=&j14=&i15=&j15=&i16=&j16=&i17=&j17=&i18=&j18=&i19=&j19=&i20=&j20=&i21=&j21=&i22=&j22=&i23=&j23=&i24=&j24=&i25=&j25=&i26=&j26=&i27=&j27=&i28=&j28=&i29=&j29=','_blank');\" class=processytplay id=\"" + newaudioaid + "\" target='" + newaudioifid + "\' title=\"" + thisaudiotitle + "\" data-onmouseover=\"if (!navigator.userAgent.match(/Android|BlackBerry|iPhone|iPad|iPod|Opera Mini|IEMobile/i)) {  this.title+=' ';  this.target='" + newaudioifid + "'; } \" onclick=\"if (!navigator.userAgent.match(/Android|BlackBerry|iPhone|iPad|iPod|Opera Mini|IEMobile/i) && this.title == this.title.trim()) {  document.getElementById('spn" + newaudioaid + "_" + newaudioifid + "').style.display='inline-block';   document.getElementById('inp" + newaudioaid + "_" + newaudioifid + "').style.display='inline-block';   if (okdclick) {  this.title+=' ';  this.target='" + newaudioifid + "';  if (document.getElementById('" + newaudioifid + "').src != this.href) { document.getElementById('" + newaudioifid + "').src=this.href; this.href=this.href.replace('thebuttonwording=','thatbuttonwording='); } } } if (9 == 6) { setTimeout(function(){ document.getElementById('" + newaudioaid + "').target='_blank'; },100); }\" href=\"//www.rjmprogramming.com.au/HTMLCSS/karaoke_youtube_api.htm?youtubeid=" + theytcode + "&theaid=" + newaudioaid + "&theiframeid=" + newaudioifid + "&thebuttonwording=" + encodeURIComponent(thisaudioih.replace(/\'/g,'`') + audioemoji.replace('<sup','<sup id="sup' + newaudioaid + '_' + newaudioifid + '" ')) + "&justaJUNKudio=&youtube_duration=22223.000&email=&emoji=on&c0=on&i0=" + spos + "&j0=" + altend + "&i1=&j1=&i2=&j2=&i3=&j3=&i4=&j4=&i5=&j5=&i6=&j6=&i7=&j7=&i8=&j8=&i9=&j9=&i10=&j10=&i11=&j11=&i12=&j12=&i13=&j13=&i14=&j14=&i15=&j15=&i16=&j16=&i17=&j17=&i18=&j18=&i19=&j19=&i20=&j20=&i21=&j21=&i22=&j22=&i23=&j23=&i24=&j24=&i25=&j25=&i26=&j26=&i27=&j27=&i28=&j28=&i29=&j29=\" rel=\"noopener\">" + thisaudioih + "</a><div id=idivf" + newaudioaid + " style=display:inline-block;><iframe onload=\"if (navigator.userAgent.match(/Android|BlackBerry|iPhone|iPad|iPod|Opera Mini|IEMobile/i)) { document.getElementById('" + newaudioaid + "').target='" + newaudioifid + "';   if (this.src.indexOf('About_Us.') != -1) { document.getElementById('" + newaudioaid + "').target='" + newaudioifid + "'; this.src=document.getElementById('" + newaudioaid + "').href + '&rand=' + Math.floor(Math.random() * 1989786);  document.getElementById('" + newaudioaid + "').title+=' ';  } } \" id=" + newaudioifid + " name=" + newaudioifid + " src='//www.rjmprogramming.com.au/HTMLCSS/karaoke_youtube_api.htm?youtubeid=" + theytcode + "&theaid=" + newaudioaid + "&theiframeid=" + newaudioifid + "&thebuttonwording=" + encodeURIComponent(thisaudioih.replace(/\'/g,'`') + audioemoji.replace('<sup','<sup id="sup' + newaudioaid + '_' + newaudioifid + '" ')) + "&justaJUNKudio=&youtube_duration=22223.000&email=&emoji=on&c0=off&i0=" + spos + "&j0=" + altend + "&i1=&j1=&i2=&j2=&i3=&j3=&i4=&j4=&i5=&j5=&i6=&j6=&i7=&j7=&i8=&j8=&i9=&j9=&i10=&j10=&i11=&j11=&i12=&j12=&i13=&j13=&i14=&j14=&i15=&j15=&i16=&j16=&i17=&j17=&i18=&j18=&i19=&j19=&i20=&j20=&i21=&j21=&i22=&j22=&i23=&j23=&i24=&j24=&i25=&j25=&i26=&j26=&i27=&j27=&i28=&j28=&i29=&j29=' style=display:none;visibility:hidden;width:" + audioonlyas[iuhg].getBoundingClientRect().width + "px;height:" + audioonlyas[iuhg].getBoundingClientRect().height + "px;></iframe><div id='spn" + newaudioaid + "_" + newaudioifid + "' style=display:NONE;white-space:pre-line;> <br><textarea data-loop='' rows=4 data-mute='' data-val='' id='inp" + newaudioaid + "_" + newaudioifid + "' style=background-color:rgb(250,250,250);display:NONE;width:95%;font-size:8px;  data-loop='' data-mute='' data-val='' type=text onblur=ansis(event); placeholder='Audio control ... P=pause/play S=stop M=mute U=unmute L=loop ...' value=''></textarea></div><div style=display:inline-block; id='ldi" + newaudioaid + "'><!--input type=text style=position:absolute;top:-567px;left:-564px; value=''></input--></div></div>" + suffixout);

             }

             if (dbidea.outerHTML.split('>')[0].indexOf('placeforvideo') != -1 || dbidea.outerHTML.split('>')[0].indexOf('areyousinging') != -1) {

               dbidea.style.visibility='visible';

             }

             }

             }

// alert(51123);

           } //else {

             //alert('oops');

           //}

         }

         if (onefound && slow_approach) {

           audioonlyas[iuhg].setAttribute('data-processed', 'y');

           setTimeout(audioytlook, 20000);

           return '';

         }

       }

    }

    return '';

  }
… to shore up the work over the last few days regarding that Safari iPhone error …
A problem repeatedly occurred with …
… we’re hoping happens less regarding recent WordPress blog postings, such as this one, in us changing external Javascript ytaudioonly.js external Javascript.
Previous relevant Audio Stream of YouTube Video Play Safari Title Tutorial is shown below.
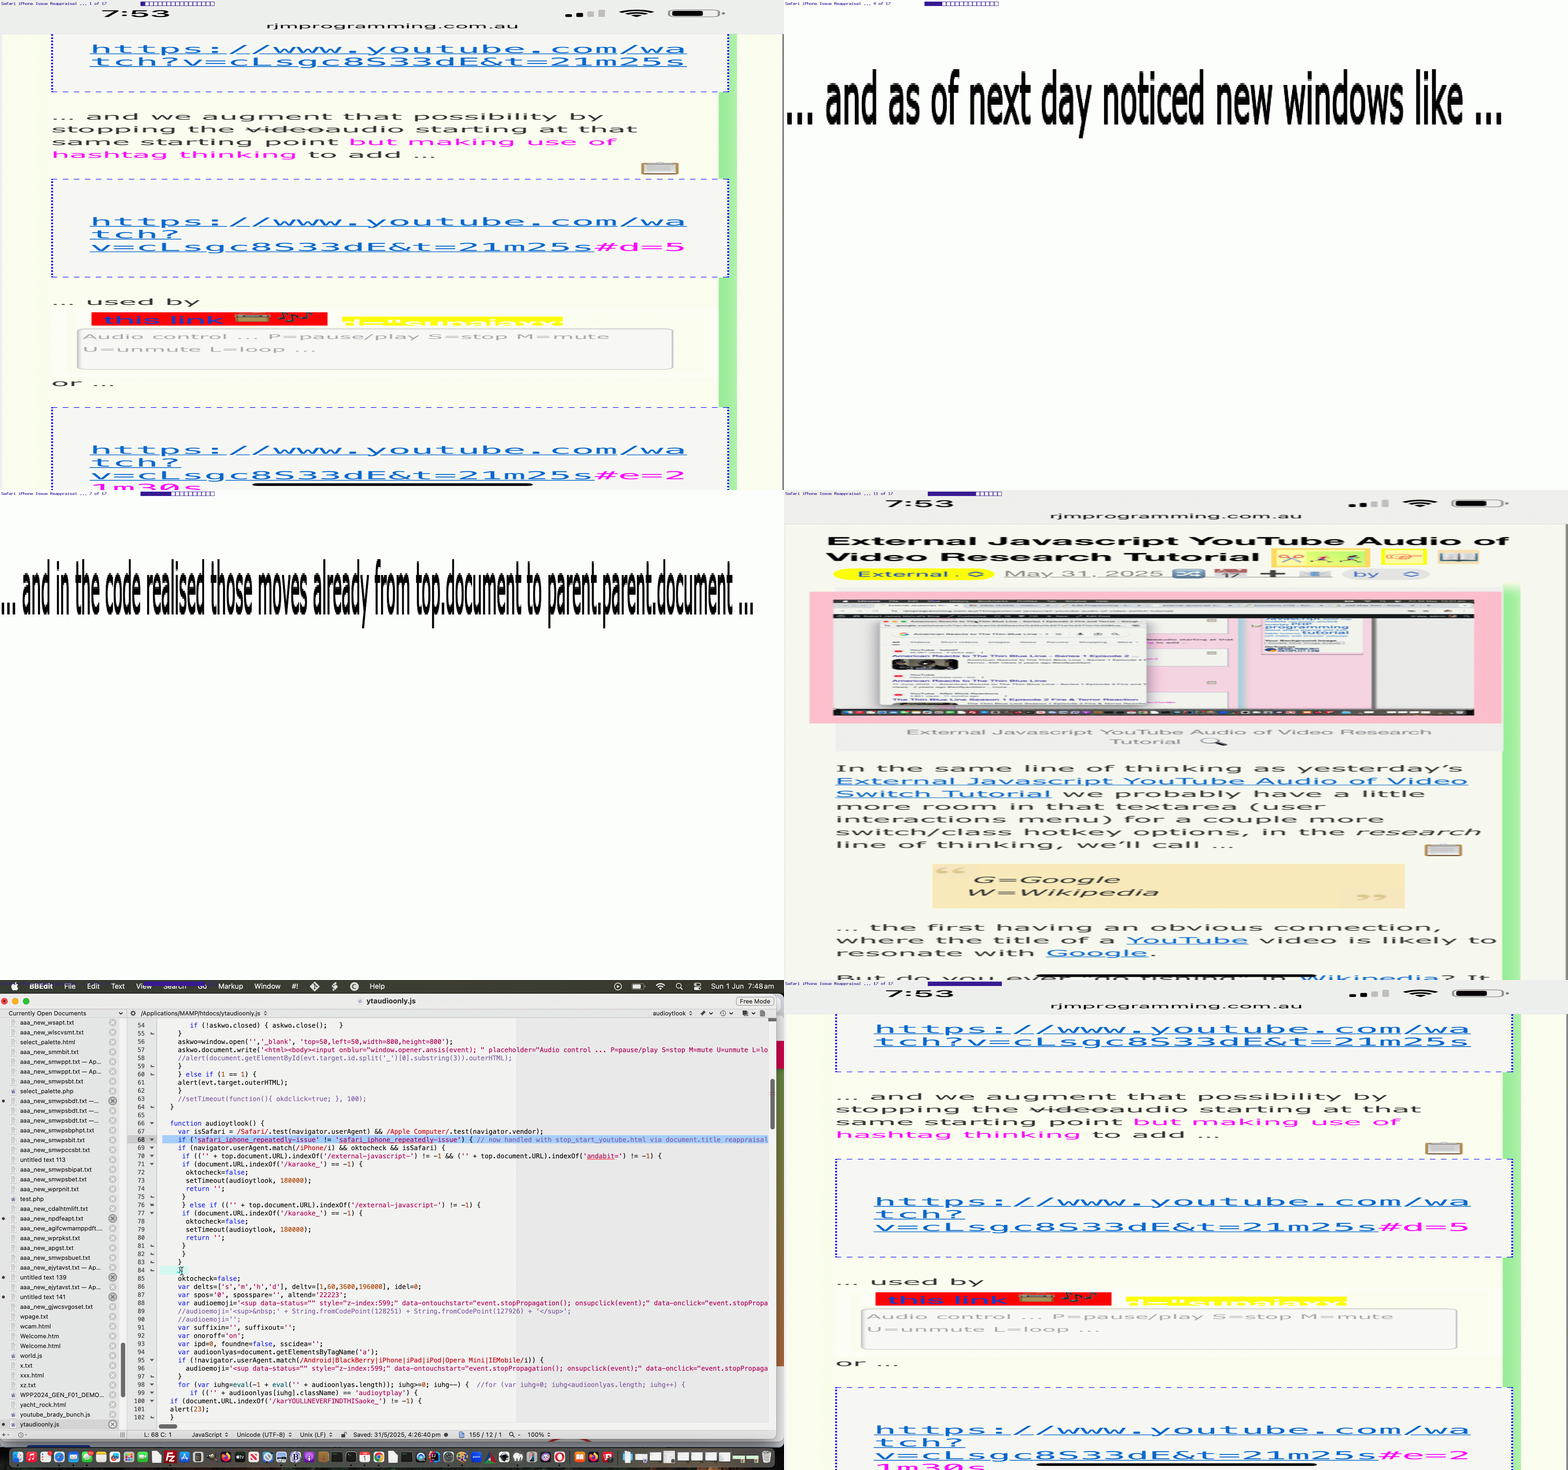
Audio Stream of YouTube Video Play Safari Title Tutorial
The day after yesterday’s Audio Stream of YouTube Video Play Safari Error Tutorial was (not only today, but) a chance to retest the …
- Safari web browser … on …
- iPhone but not iPad, gobsmackingly (of devices that we know of)
… problem at issue, from yesterday’s timing approach, and discovered two things, with fresh eyes (and nose, or has Nala just released … Nala!!) …
- minutes down the line, the problem could still occur … maybe we were just pushing the problem just further into the future … and …
- we noticed this weird thing where, rather than crash with the error …
A problem repeatedly occurred with …
… sometimes, instead, the WordPress blog webpage would redirect to a whole lot of YouTube windows derived from stop_start_youtube.html (our inhouse YouTube Embedded iframe API interfacer) means by which it opens YouTube videos, briefly, to determine their duration
… and then it tweaked with us, looking at (the “grandchild” level of hierarchy) stop_start_youtube.html code afresh (just with the eyes, that is?!) that regarding the …
[windowObject].document.URL
… attribute, we’d had to change from top.document.URL thinking to parent.parent.document.URL thinking. What if the same reasoning is sometimes needed because there is a conflict of interest when using …
[windowObject].document.title
… attribute (which, in terms of top.document.title have found immensely useful, in the past, as a repository to place information that can be shared by all hierarchical levels of a web application project, and used a lot, here), up at wherever top (as a [windowObject]) points at? And so we started, conditionally, via …
var ttt=document;   //sometimes we will use parent.parent.document.title to write to rather than top.document.title

if (window.top) {

ttt=top.document;

if (('' + ttt.title).indexOf('External Javascript ') == 0 || ('' + ttt.URL).replace('/wordpress', '/ITblog').toLowerCase().indexOf('/itblog') != -1) {

  ttt=parent.parent.document;

}

}
… starting to refer to what was top.document.title as ttt.title in the reworked stop_start_youtube.html inhouse YouTube API interfacer code.
Implementing this, improved matters a lot! Yay!!!
Previous relevant Audio Stream of YouTube Video Play Safari Error Tutorial is shown below.

Audio Stream of YouTube Video Play Safari Error Tutorial
Like with GeoJson World Countries SVG Overlay Safari Error Tutorial we have another incarnation of the …
A problem repeatedly occurred with …
… style of erroneous webpage scenario hosting an iframe using that Audio Stream of YouTube Video Play web application logic within some of this WordPress blog’s postings, but very specifically only using …
- Safari web browser … on …
- iPhone but not iPad, gobsmackingly (of devices that we know of)
… as we tested (and you should do as many tests as you can over browsers and platforms when you get this error in particular).
We think, this way, as with the situation below, you can get these errors to do with memory issues when using the browser/platform combination where it happens.
However, as a programmer you should be curious enough to test and debug for memory leaks, at the very least, in your own code, and any setInterval or setTimeout related abnormalities that may be causing the error. Luckily, if you have access to …
- iPhone Safari web browser …
- macOS Safari web browser with Developer debugging capabilities …
- Apple white lead that connect these two
… then you can …
- be in Safari web browser at new tabs in both iPhone and macOS (eg. MacAir) …
- connect the two devices with Apple White Lead
- on iPhone Safari type in and go to URL where problem is known
- on macOS Safari click Developer menu to reach and select the session with offending URL
- debug via the Console and Network and Errors and whatever else helps to try to track down issues with the web application, in this environment
We think us changing external Javascript ytaudioonly.js this way …
  var oktocheck=true;


  function audioytlook() {

    var isSafari = /Safari/.test(navigator.userAgent) && /Apple Computer/.test(navigator.vendor);

    if (navigator.userAgent.match(/iPhone/i) && oktocheck && isSafari) {

     if (('' + top.document.URL).indexOf('/external-javascript-') != -1 && ('' + top.document.URL).indexOf('andabit=') != -1) {

     if (document.URL.indexOf('/karaoke_') == -1) {

      oktocheck=false;

      setTimeout(audioytlook, 180000);

      return '';

     }

     } else if (('' + top.document.URL).indexOf('/external-javascript-') != -1) {

     if (document.URL.indexOf('/karaoke_') == -1) {

      oktocheck=false;

      setTimeout(audioytlook, 180000);

      return '';

     }

     }

    }

    oktocheck=false;

    /* Rest of function audioytlook is as is, below ... */

  }
… having helped here shows, again, that timing can be the issue with this error. But to know where to time things better will probably be the result of doing this Safari iPhone debugging via macOS Safari web browser Developer menu.
Previous relevant GeoJson World Countries SVG Overlay Safari Error Tutorial is shown below.
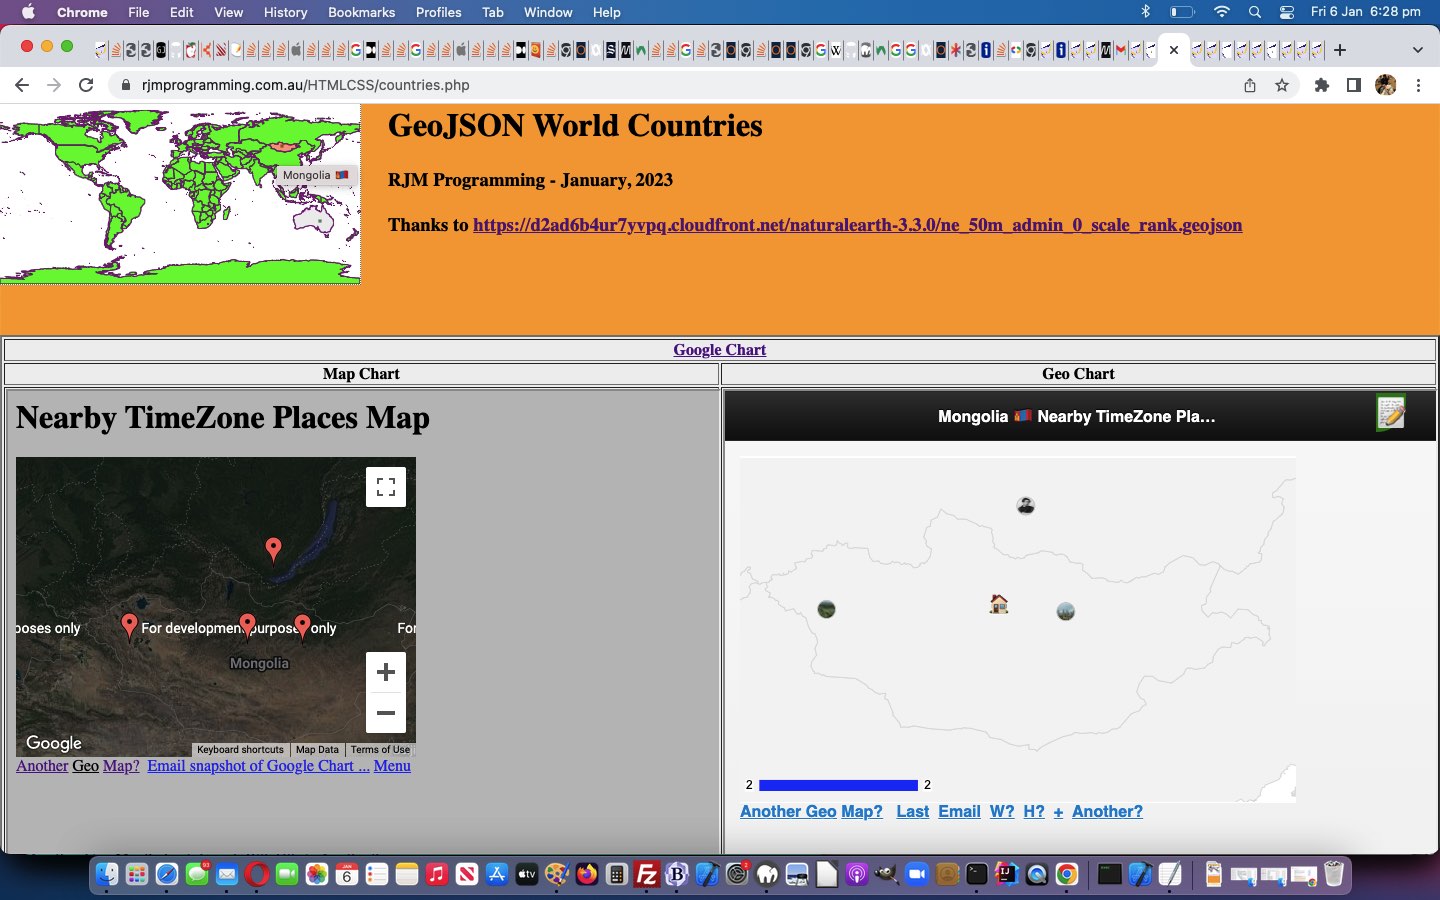
GeoJson World Countries SVG Overlay Safari Error Tutorial
Mostly on smaller devices (such as an iPhone), but elsewhere as well, but less drastically, this morning, using our current Display GeoJson Countries web application we would get the Safari web browser error …
A problem repeatedly occurred with https://www.rjmprogramming.com.au/HTMLCSS/countries.php
… with web application work up to yesterday’s GeoJson World Countries SVG Overlay Colour Infill Tutorial.
On discovering our first solution theory of turning yesterday’s mapsvg.js external Javascript work into an async piece of work made no difference to this situation, we surmised that the huge amount of content held in the Javascript (ie. client side) global variable appendtoinnerHTML was causing memory issues. We couldn’t shift much to do with the overall amount of “data” needing to be handled, in order to implement country SVG colour infilling, but we could shift the data from being …
- client side (external) Javascript held … to, instead, (have that data) be (determined on the) …
- server side PHP filling in the contents of our (relevant) HTML div id=svgd ahead of the document.body onload event timing …
<?php
$icnt=0;


function apptohtmstuff($coordsare, $origc) {

  global $icnt;

  $minl=-1;

  $mint=-1;

  $maxl=-1;

  $maxt=-1;

  $zysare=explode(',', $coordsare);

  $svgcis='';

  for ($ij=0; $ij<sizeof($zysare); $ij+=2) {

    if ($minl < 0) {

      $minl=$zysare[$ij];

      $maxl=$zysare[$ij];

      $mint=$zysare[1 + $ij];

      $maxt=$zysare[1 + $ij];

    } else {

      if ($zysare[$ij] < $minl) { $minl=$zysare[$ij];  }

      if ($zysare[$ij] > $maxl) { $maxl=$zysare[$ij];  }

      if ($zysare[1 + $ij] < $mint) { $mint=$zysare[1 + $ij];  }

      if ($zysare[1 + $ij] > $maxt) { $maxt=$zysare[1 + $ij];  }

    }

  }


  for ($ij=0; $ij<sizeof($zysare); $ij+=2) {

    if ($svgcis == '') {

      $svgcis='' . ($zysare[$ij] - $minl) . ',' . ($zysare[1 + $ij] - $mint);

    } else {

      $svgcis.=' ' . ($zysare[$ij] - $minl) . ',' . ($zysare[1 + $ij] - $mint);

    }

  }


  $icnt++;

  return '<div title="' . $coordsare . '" id="dsa' . (-1 + $icnt) . '" style="position:absolute;left:' . $minl . 'px;top:' . $mint . 'px;width:' . ($maxl - $minl) . 'px;height:' . ($maxt - $mint) . ';display:BLOCK;z-index:24;"><svg height="100%" width="100%"><polygon points="' . $svgcis . '" style="fill:lime;stroke:purple;stroke-width:1"></polygon></svg></div>';

}
?>
… meaning the web application’s underlying HTML size increased at the expense of no need for external Javascript involvement any more
… in our changed countries.php web application you can also try below.
We’re not exactly sure why, but …
- this improved web application stability …
…everywhere … and an idea we’d ditched yesterday of …
- idea to pre-colour “land” parts of the world GeoJson map green (ahead of the document.body onload event) also came good (after causing problems yesterday)
… meaning now, “overlay” wise, we could say …
- document.body lowest level …
- overlayed by HTML canvas element plotted with world country linework …
- overlayed by HTML img (transparent image) element and its associated image map area elements … and today we add into the mix …
- HTML div hosting SVG elements overlay
ing initialized with “land” parts green infilled SVG at a mid range z-index (only as well as when called upon) individual GeoJson entities overlay
… and we (reckon we’ve) improved the colour coding user experience at the same time.
We noticed that tweaks in the changed …
var lastflagged='', appendtoinnerHTML='', waitplease=false; // used to make sure "area" element onclick code precedes any document.body onmousedown or ontouchdown code


function checkdsa(ath) {

  waitplease=true;

  var wasih='';

  var athcoords=('' + ath.coords); //.substring(0, Math.floor(eval(0.1 * ('' + ath.coords).length)));

  if (document.getElementById('svgd').innerHTML.indexOf(('' + athcoords)) != -1) {

    wasih='<div title=' + String.fromCharCode(34) + '' + ath.coords + document.getElementById('svgd').innerHTML.split(ath.coords)[1].split('<div ')[0];

    if (lastflagged == '') {

    if (wasih.indexOf(' id=' + String.fromCharCode(34)) != -1) { lastflagged=wasih.split(' id=' + String.fromCharCode(34))[1].split(String.fromCharCode(34))[0]; } else { lastflagged=''; }

    } else {

    document.getElementById(lastflagged).innerHTML=document.getElementById(lastflagged).innerHTML.replace(/rgba\(255\,87\,51\,0.5\)/g, 'rgba(200,200,200,0.3)');

    if (wasih.indexOf(' id=' + String.fromCharCode(34)) != -1) { lastflagged=wasih.split(' id=' + String.fromCharCode(34))[1].split(String.fromCharCode(34))[0]; } else { lastflagged=''; }

    }

    if (lastflagged != '') {

    document.getElementById(lastflagged).innerHTML=document.getElementById(lastflagged).innerHTML.replace('z-index:24;', 'z-index:123;').replace('lime;', 'rgba(255,87,51,0.5);');

    document.getElementById(lastflagged).title=ath.title;

    } else {

    document.getElementById('svgd').innerHTML=document.getElementById('svgd').innerHTML.replace(wasih, '<div title=' + String.fromCharCode(34) + '' + ath.title + wasih.split(ath.coords)[1].split('<div ')[0].replace('none;', 'block;z-index:123;').replace('lime;', 'rgba(255,87,51,0.5);'));

    }

  } else if (('' + appendtoinnerHTML).indexOf(('' + athcoords)) != -1) {

    if (document.getElementById('svgd').innerHTML.indexOf(' title=' + String.fromCharCode(34) + '' + ath.title + '' + String.fromCharCode(34) + '') != -1) {

    document.getElementById('svgd').innerHTML=document.getElementById('svgd').innerHTML.replace(/rgba\(255\,87\,51\,0.5\)/g, 'rgba(200,200,200,0.3)');

    document.getElementById('svgd').innerHTML+='<div title=' + String.fromCharCode(34) + '' + ath.title + appendtoinnerHTML.split(ath.coords)[1].split('<div ')[0].replace('none;', 'block;z-index:123;').replace(/\ id\=/g, ' data-id=').replace('lime;', 'rgba(255,87,51,0.5);');

    } else {

    document.getElementById('svgd').innerHTML=document.getElementById('svgd').innerHTML.replace(/rgba\(255\,87\,51\,0.5\)/g, 'rgba(200,200,200,0.3)');

    document.getElementById('svgd').innerHTML+='<div title=' + String.fromCharCode(34) + '' + ath.title + appendtoinnerHTML.split(ath.coords)[1].split('<div ')[0].replace('none;', 'block;z-index:123;').replace('lime;', 'rgba(255,87,51,0.5);');

    }

  }

  waitplease=false;

  return '';

}
… also lessened the burden on the client side by only asking any Javascript DOM command operations act on single HTML element at a time, not a whole swathe of hosted ones, in any operation.
Previous relevant GeoJson World Countries Geo Chart Tutorial is shown below.
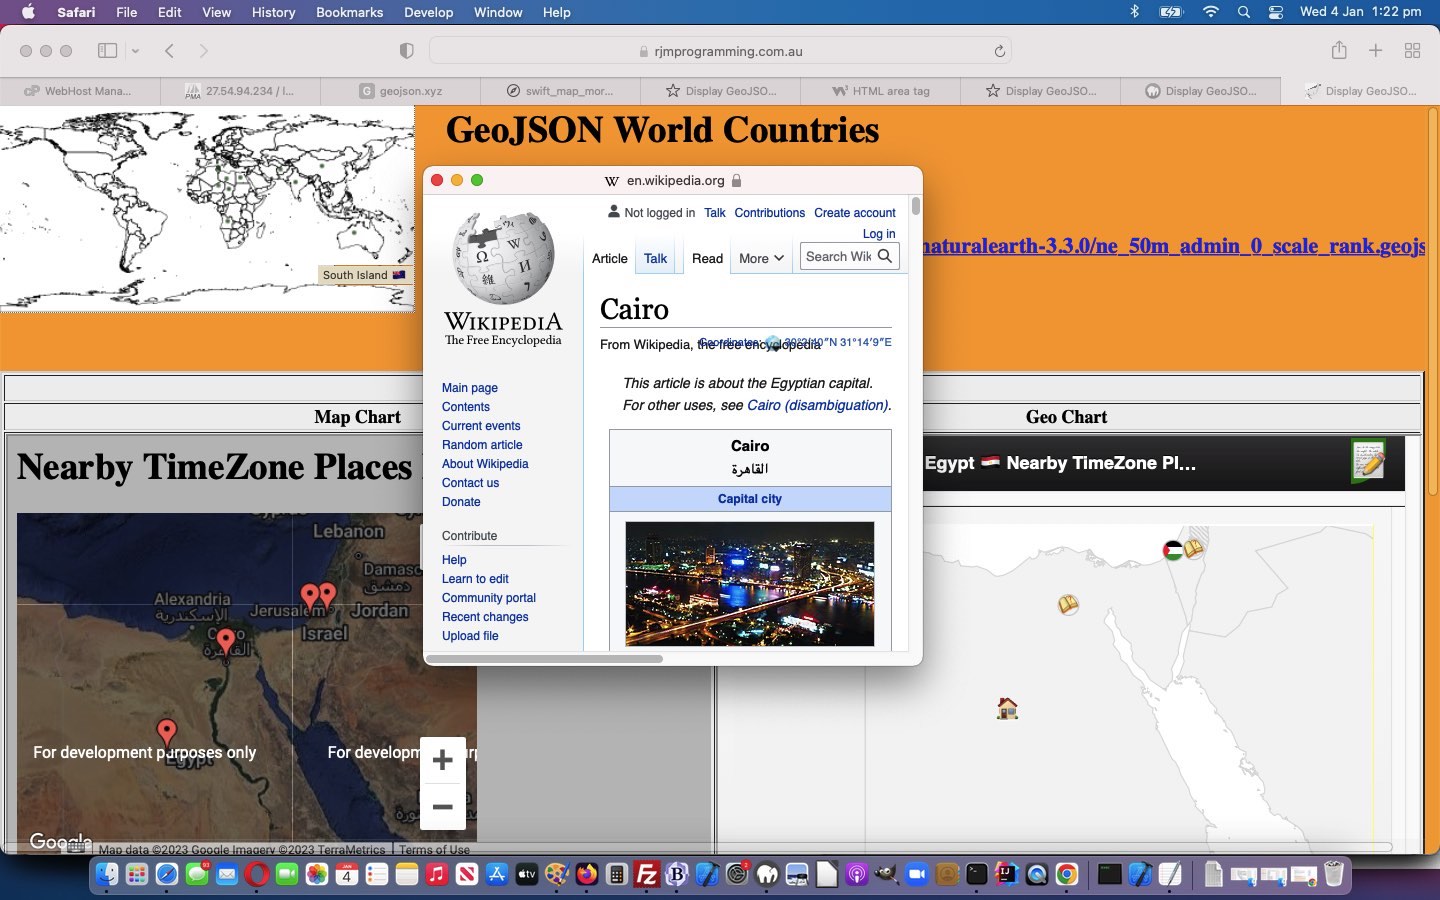
GeoJson World Countries Geo Chart Tutorial
There are many advantages regarding today’s task to …
Integrate Google Chart Geo Chart
… as an additional “drill down” map option, functionality adding onto the work of yesterday’s GeoJson World Countries Tutorial.
What deducible data item needs to be determined for these Geo Charts to work? We need a way to deduce ISO-2 character country codes from the ISO-3 character codes existing in the GeoJson “countries.geojson” data from yesterday’s work. We happened upon the extremely generous mapping data webpage to help with these ISO-2 character deductions …
<?php
$geojsonis=file_get_contents('countries.geojson');

$parts=explode("]]", $geojsonis);

$globalattr="";

$mappings=file_get_contents('http://gist.github.com/tadast/8827699');  // thanks

if (strpos($mappings, '>IN</td>') !== false) {

  $mappings.='<td>IN</td><td>KAS</td><td>EH</td><td>SAH</td><td>SO</td><td>SOL</td><td>SS</td><td>SDS</td><td>XK</td><td>KOS</td><td>CY</td><td>CYN</td></body>';

}


for ($i=0; $i<(-1 + sizeof($parts)); $i++) {

  if (strpos($parts[$i], '"sr_sov_a3":"') !== false) {

    $globalattr=' data-iso3="' . explode('"', explode('"sr_sov_a3":"', $parts[$i])[1])[0] . '"';

    if (strpos($mappings, '>' . explode('"', explode('"sr_sov_a3":"', $parts[$i])[1])[0] . '</td>') !== false) {

      $iparts=explode('>' . explode('"', explode('"sr_sov_a3":"', $parts[$i])[1])[0] . '</td>', $mappings);

      $globalattr.=' data-iso2="' . explode('>', explode('</td>', $iparts[0])[-2 + sizeof(explode('</td>', $iparts[0]))])[-1 + sizeof(explode('>', explode('</td>', $iparts[0])[-2 + sizeof(explode('</td>', $iparts[0]))]))] . '"';

    } else if (substr(explode('"', explode('"sr_sov_a3":"', $parts[$i])[1])[0],-1,1) >= '0' && substr(explode('"', explode('"sr_sov_a3":"', $parts[$i])[1])[0],-1,1) <= '9') {

      $globalattr.=' data-iso2="' . substr(explode('"', explode('"sr_sov_a3":"', $parts[$i])[1])[0],0,2) . '"';

    }

  }

  if (strpos($parts[$i], '"sr_subunit":"') !== false) {

    $globalattr.=' data-cname="' . explode('"', explode('"sr_subunit":"', $parts[$i])[1])[0] . '"';

  }

  $coords=str_replace('[','',str_replace(']','',explode('[[' , $parts[$i])[-1 + sizeof(explode('[[' , $parts[$i]))]));

  $newcoords=$coords;

  if (!$dolatlong || 1 == 1) {

  $lls=explode(",", $coords);

  $newcoords="";

  for ($j=0; $j<sizeof($lls); $j+=2) {

  $lls[$j]=($lls[$j] + $longoff) * $factor;

  $lls[$j + 1]=($lls[$j + 1] + $latoff) * $factor;

  if ($newcoords != "") { $newcoords.=",";  $htmlis=str_replace("}", " context.lineTo(" . $lls[$j] . ',' . ((180.0 * $factor) - $lls[$j + 1]) . "); \n}", $htmlis);  } else { $htmlis=str_replace("}", " context.stroke(); \n context.beginPath(); \n context.moveTo(" . $lls[$j] . ',' . ((180.0 * $factor) - $lls[$j + 1]) . "); \n}", $htmlis); }

  $newcoords.='' . $lls[$j] . ',' . ((180.0 * $factor) - $lls[$j + 1]);

  }

  }

  $abit.="<area" . $globalattr . " onclick=\"ouralert(this.getAttribute('data-cname'),this.getAttribute('data-iso3'),this.getAttribute('data-iso2'),'Longitude,Latitude coordinates are " . $coords . "');\" shape='poly' coords='" . $newcoords . "'></area>\n";

  //echo "<area type='poly' coords='" . $newcoords . "'></area>\n";

}
?>
… in our image map area elements PHP creation code above. As you can see, extra “intelligence”, moving forward, is contained in area element global data attributes.
Which leaves us with why any of this helps functionality within our changed countries.php web application you can also try below?
- Geo Chart can zoom into a country view …
- Geo Chart can involve emoji (🏠 &127968;) or image (SVG) circle based symbology for the “User Clicked Place” and nearby TimeZone places respectively …
- all these symbols can be clicked to open popup windows containing TimeZone Place Wikipedia webpages of relevance …
- an emoji national flag (eg. Zambia “ZA” could be used to derive 🇿🇦 🇿🇦 flag emoji) derived from those ISO-2 character codes can supplement the GeoJson (more ISO-3 character based) names presented in the underlying data, in the Geo Chart title …
- contextualizing the accompanying Map Chart … and …
- vice versa regarding hovering over symbology (which works on Map Chart, but not Geo Chart) …
- within the Map Chart iframe a “Geo” link can glean a “zoomed out” world Geo Chart view of your TimeZone places
And feel free to (re-)try our tweaked “to make thinner the coastline linework” regions.php GeoJson PHP web application in a new window, or you can also try below.
Previous relevant GeoJson World Countries Tutorial is shown below.
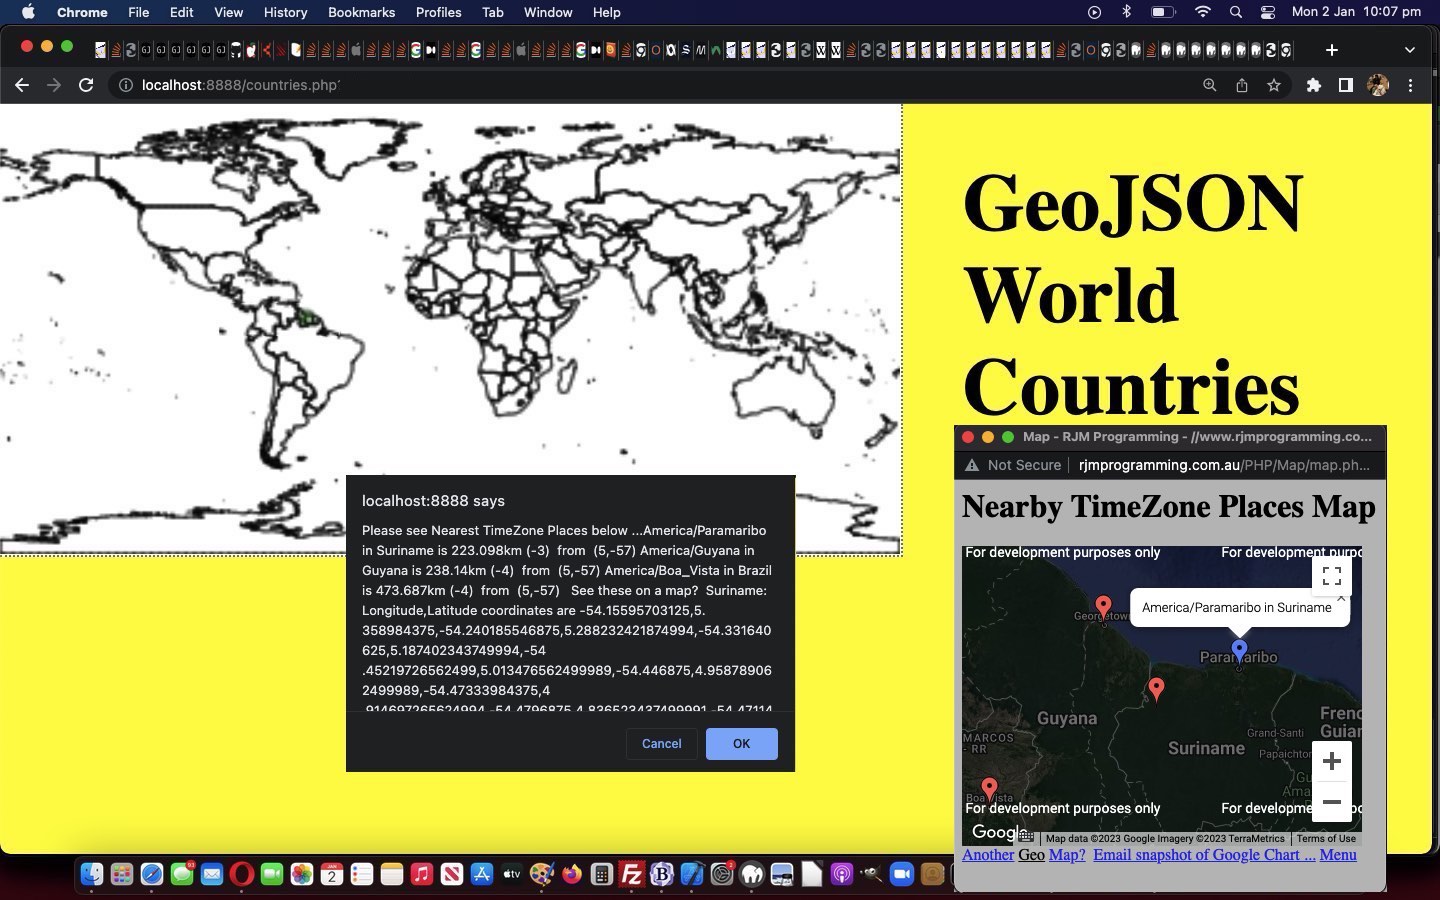
GeoJson World Countries Tutorial
Know your GeoJson! Yes, pretty obviously, any two GeoJson datasets might display the same in that “map plotting” sense, but one might have different and/or more “intelligence” than the other. Often, an XML has more “intelligence” than equivalent HTML (barring the use of global data attributes, that is), as today’s Corollacorollary.
And so, moving on from yesterday’s GeoJson World Coastline TimeZone Tutorial, today, we present a new GeoJson admin 0 countries we download, and upload as “countries.geojson” data set, again via the excellent HTTP://geojson.xyz/ repository, thanks.
From it, we do get a different JSON additional “intelligence” …
{"type":"FeatureCollection","features":[{"type":"Feature","properties":{"scalerank":1,"labelrank":1,"sr_sov_a3":"ZWE","sr_adm0_a3":"ZWE","sr_gu_a3":"ZWE","sr_su_a3":"ZWE","sr_subunit":"Zimbabwe","featureclass":"Admin-0 scale ranks"},"geometry":{"type":"Polygon","coordinates":[[[31.287890625000017,-22.40205078125001],[31.197265625,-22.34492187500001],[31.07343750000001,-22.30781250000001],[30.916113281250006,-22.29072265625001],[30.71162109375001,-22.2978515625],[30.46015625000001,-22.32900390625001],[30.1904296875,-22.291113281250006],[29.90234375,-22.184179687500006],[29.6630859375,-22.146289062500003],[29.37744140625,-22.19277343750001],[29.36484375,-22.193945312500006],[29.315234375000017,-22.15771484375],[29.237207031250023,-22.07949218750001],[29.106835937500023,-22.065722656250003],[29.07148437500001,-22.047460937500006],[29.042382812500023,-22.018359375],[29.023339843750023,-21.98125],[29.01582031250001,-21.93994140625],[29.03730468750001,-21.811328125],[29.02558593750001,-21.796875],[28.99072265625,-21.78144531250001],[28.919335937500023,-21.766015625],[28.74775390625001,-21.707617187500006],[28.532031250000017,-21.65126953125001],[28.181640625,-21.58935546875],[28.04560546875001,-21.573046875],[28.014062500000023,-21.55419921875],[27.974609375,-21.50673828125001],[27.90742187500001,-21.35908203125001],[27.844140625000023,-21.261523437500003],[27.693457031250006,-21.11103515625001],[27.66943359375,-21.064257812500003],[27.67695312500001,-20.94482421875],[27.688085937500006,-20.84833984375001],[27.70429687500001,-20.76640625],[27.69697265625001,-20.689746093750003],[27.69482421875,-20.59453125],[27.699609375000023,-20.53066406250001],[27.679296875,-20.503027343750006],[27.624609375,-20.48359375000001],[27.46894531250001,-20.47480468750001],[27.28076171875,-20.47871093750001],[27.27460937500001,-20.3818359375],[27.256738281250023,-20.23203125],[27.221484375000017,-20.145800781250003],[27.17822265625,-20.10097656250001],[27.091796875,-20.05419921875],[26.91669921875001,-19.99013671875001],[26.67822265625,-19.89277343750001],[26.474609375,-19.748632812500006],[26.241015625000017,-19.5693359375],[26.168066406250006,-19.53828125000001],[26.081933593750023,-19.369921875],[25.95068359375,-19.08173828125001],[25.95917968750001,-18.985644531250003],[25.939355468750023,-18.93867187500001],[25.811914062500023,-18.79707031250001],[25.78369140625,-18.72353515625001],[25.76123046875,-18.64921875],[25.55830078125001,-18.441796875],[25.4892578125,-18.35126953125001],[25.43671875000001,-18.234960937500006],[25.384375,-18.14199218750001],[25.340234375000023,-18.1044921875],[25.28242187500001,-18.04121093750001],[25.242285156250006,-17.969042968750003],[25.224023437500023,-17.91523437500001],[25.239062500000017,-17.843066406250003],[25.2587890625,-17.793554687500006],[25.451757812500006,-17.84511718750001],[25.55712890625,-17.84951171875001],[25.6396484375,-17.82412109375001],[25.741601562500023,-17.858203125],[25.86328125,-17.951953125],[25.995898437500017,-17.969824218750006],[26.139550781250023,-17.91171875],[26.333398437500023,-17.929296875],[26.577539062500023,-18.022558593750006],[26.779882812500006,-18.04150390625],[27.020800781250017,-17.95839843750001],[27.235742187500023,-17.728320312500003],[27.437890625000023,-17.51191406250001],[27.63671875,-17.262109375],[27.75654296875001,-17.060351562500003],[27.932226562500006,-16.89619140625001],[28.16376953125001,-16.76972656250001],[28.399804687500023,-16.66279296875001],[28.760644531250023,-16.53193359375001],[28.760546875000017,-16.53212890625001],[28.83271484375001,-16.424121093750003],[28.856738281250017,-16.30615234375],[28.856738281250017,-16.14228515625001],[28.875585937500006,-16.0361328125],[28.9130859375,-15.98779296875],[28.973046875000023,-15.950097656250009],[29.050585937500017,-15.901171875],[29.287890625000017,-15.776464843750006],[29.4873046875,-15.69677734375],[29.729589843750006,-15.644628906250006],[29.994921875000017,-15.64404296875],[30.25068359375001,-15.643457031250009],[30.39609375,-15.64306640625],[30.39814453125001,-15.80078125],[30.409375,-15.978222656250011],[30.437792968750017,-15.995312500000011],[30.630175781250017,-15.999218750000011],[30.938769531250017,-16.01171875],[31.236230468750023,-16.02363281250001],[31.426171875000023,-16.15234375],[31.48984375,-16.1796875],[31.687597656250006,-16.214160156250003],[31.939843750000023,-16.428808593750006],[32.243261718750006,-16.44873046875],[32.45195312500002,-16.515722656250006],[32.635839843750006,-16.589453125],[32.741796875,-16.67763671875001],[32.81025390625001,-16.69765625],[32.902929687500006,-16.704199218750006],[32.94804687500002,-16.71230468750001],[32.93789062500002,-16.775976562500006],[32.87626953125002,-16.88359375],[32.884375,-17.03779296875001],[32.969335937500006,-17.2515625],[32.98076171875002,-17.4375],[32.9546875,-17.765429687500003],[32.95556640625,-18.08291015625001],[32.96464843750002,-18.1962890625],[32.978515625,-18.271484375],[32.99638671875002,-18.312597656250006],[32.99306640625002,-18.35957031250001],[32.942480468750006,-18.49267578125],[32.90166015625002,-18.632910156250006],[32.90029296875002,-18.6890625],[32.88457031250002,-18.728515625],[32.8544921875,-18.763671875],[32.72197265625002,-18.828417968750003],[32.69921875,-18.868457031250003],[32.69970703125,-18.94091796875],[32.71650390625001,-19.00185546875001],[32.766210937500006,-19.02431640625001],[32.826171875,-19.05878906250001],[32.84980468750001,-19.10439453125001],[32.85,-19.152441406250006],[32.83095703125002,-19.24140625000001],[32.77763671875002,-19.388769531250006],[32.83076171875001,-19.558203125],[32.89042968750002,-19.668066406250006],[32.97265625,-19.79541015625],[33.00673828125002,-19.873828125],[33.0048828125,-19.93017578125],[32.992773437500006,-19.98486328125],[32.86962890625,-20.2171875],[32.780859375,-20.36152343750001],[32.67255859375001,-20.51611328125],[32.529296875,-20.613085937500003],[32.49238281250001,-20.659765625],[32.477636718750006,-20.712988281250006],[32.48281250000002,-20.82890625],[32.476171875,-20.95009765625001],[32.353613281250006,-21.136523437500003],[32.429785156250006,-21.29707031250001],[32.41240234375002,-21.311816406250003],[32.37109375,-21.33486328125001],[32.19472656250002,-21.515429687500003],[32.01630859375001,-21.698046875],[31.88593750000001,-21.83154296875],[31.737695312500023,-21.9833984375],[31.57148437500001,-22.15351562500001],[31.429492187500017,-22.298828125],[31.287890625000017,-22.40205078125001]]]}}
… and “mapping look” because country borders are added in, and some JSON attributes we can call on to allow for …
- the similar Google Chart Map Chart maps introduced yesterday into the user interaction mix … as well as …
- Wikipedia, thanks, webpage lookup possibilities calling on those new GeoJson property attributes presented within the dataset above
We enable this, as we just add in some Javascript popup window type equals “prompt” to the existant “confirm” and “alert” logic of yesterday.
Feel free to try the how we got there regions.php GeoJson PHP World Countries web application in a new window, or below …
Previous relevant GeoJson World Coastline TimeZone Tutorial is shown below.
GeoJson World Coastline TimeZone Tutorial
Luckily for programmers all over, the organization of TimeZones has had an International flavour in its development and maintenance. As such, given the “purely coastline” GeoJson data involved in our fledgling PHP web application of yesterday’s GeoJson World Coastline Primer Tutorial a useful arrangement for improvement involves …
- document.body onclick event co-ordinates … able to be converted to …
- longitude, latitude (easily, only because of our simplistic map projection, of course) … onfed to …
- our inhouse “TimeZone Places” web application PHP helper
… can have us helping out your curious web “clicking” user with the 3 nearest TimeZone places, as a reference as to where they are “clicking” in the world.
Feel free to try our improved regions.php GeoJson PHP web application in a new window, or below …
Stop Press
Our efforts in making our new tweaked regions.php GeoJson PHP web application more mobile platform user friendly reminds us about a salutary issue regarding touch gestures …
- in a discrete click methodology of interest, you could adopt a non-mobile “onmousedown” logic set that does not get interfered with by a mobile “ontouchdown” logic set (perhaps leaving “onclick” event, which both non-mobile and mobile both recognise, for another event logic role) … and …
- neither will interrupt the mobile gestures associated with swiping and pinching, which refer to the events “ontouchstart” and “ontouchend” at either end of their lifespan
Previous relevant GeoJson World Coastline Primer Tutorial is shown below.
GeoJson World Coastline Primer Tutorial
We’re keen to further explore the possibilities of GeoJson public data sets, further to yesterday’s Swift Playgrounds on macOS Map Emoji Tutorial.
And then we remembered some of the methodologies we used with Responsive Web Design Landing Page Image Map Tutorial, talking about image maps …
And so, we arrive at a long planned for tilt at Image Map functionality that we often turn to Mobilefish.Com and its excellent Image Map Creation to help us out … but not today?! Why not? We have a funny set of needs, they being …
- our Image Map’s image will have a variable set of width x height dimensions …
- our Image Map’s image will be transparent
- our Image Map needs to have a hole left aside inside it where the functionality that originally existed (and pointed to WordPress Blog content like you are reading), is still working
… the first two ideas of which, along with …
… in our “early days” “proof of concept” regions.php GeoJson PHP web application.
If this was interesting you may be interested in this too.
If this was interesting you may be interested in this too.
If this was interesting you may be interested in this too.
If this was interesting you may be interested in this too.
If this was interesting you may be interested in this too.
If this was interesting you may be interested in this too.
If this was interesting you may be interested in this too.
If this was interesting you may be interested in this too.
If this was interesting you may be interested in this too.
If this was interesting you may be interested in this too.
If this was interesting you may be interested in this too.

