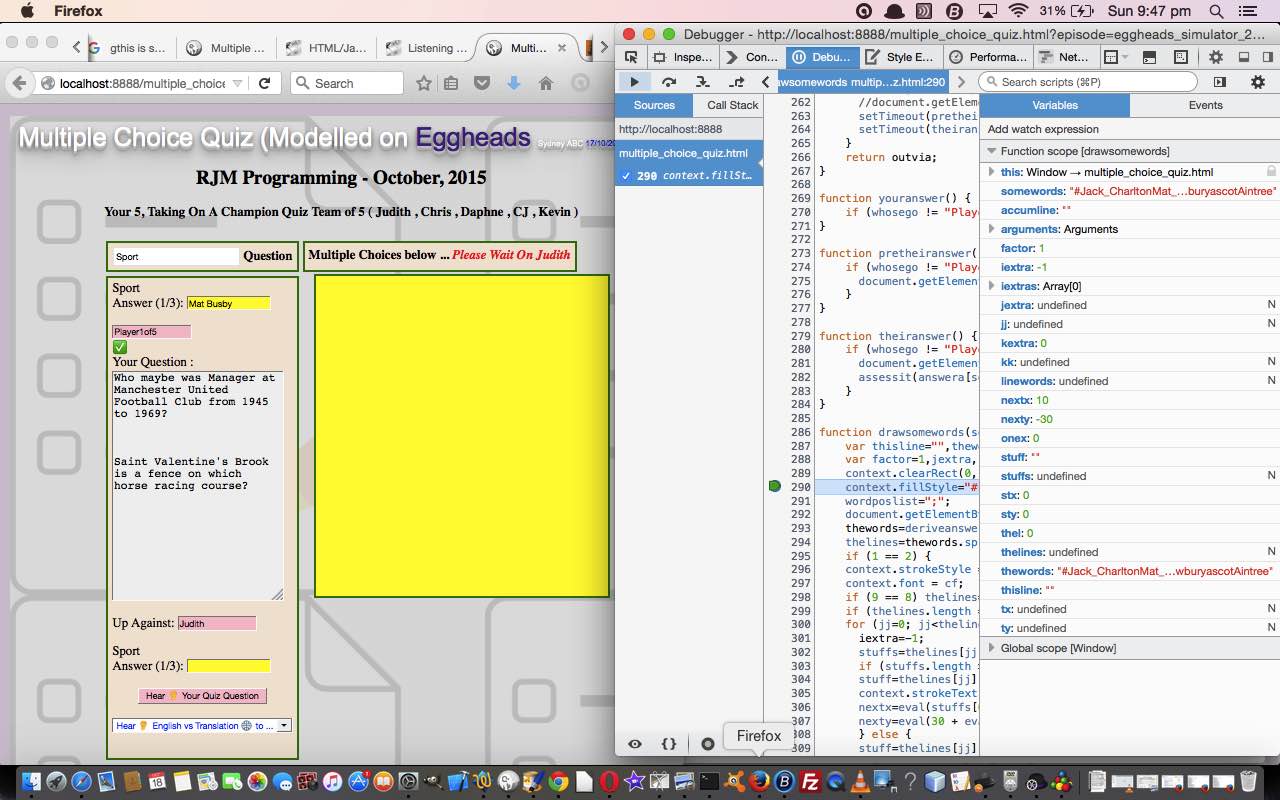
We like to work with the Firefox web browser generally, and in that environment, we tend to like the Firebug addon to examine HTML and Javascript and CSS issues. However, when it comes to debugging Javascript at a detailed level, the default Firefox Web Developer Tool called “Inspector” comes into its own.
Normally we find console.log() calls and/or alert() windows useful for nutting out 99.99% of Javascript issues you can think of, but occasionally in nutting through a problem, you need (or it is advantageous) to stop at a certain line of code and examine the situation. In most debuggers this is referred to as setting a Breakpoint on this line of code and having a Watch of a variable, or all the variables, in place to see what the situation is at that exact point of time.
The other thing about Firefox’s “Inspector” is that it is entered into if a webpage throws an exception, and presents a “Debug” button for you to press to find out more detail about the problem, such as, more than likely, a line of Javascript where the problem occurs and perhaps a Watch of some variables as it stands at the time of the exception being thrown.
Of course other web browsers have their own (Javascript) debugging mechanisms. For example the Safari product is called “Web Inspector”, and it works in a similar manner to Firefox’s Inspector.
Let’s just go over some of the steps to debug a Javascript problem in Firefox using “Inspector” …
- The event that normally happens to trigger you to gravitate towards using the debugger is a Javascript Error Message resulting from navigating to a webpage with the Firefox web browser. Probably good to write that Error Message down or record it to a file or the copy buffer, and note down a line number of code that causes the problem.
- So probably best now, is to do the same again, except that you start up Firefox’s “Inspector” ahead of time. “Inspector” is available via the Tools menu’s Web Developer submenu’s “Inspector” option.
- Pick “Inspector” Debugger tab and HTML and Javascript and CSS code opens up for you.
- Hopefully, now, you see code line numbers present and to set a Breakpoint on a line of code left click at the line number’s left, and a little light blue and dark blue radio button appears to show that a Breakpoint has been added here.
- Refresh the webpage as necessary to run the HTML and Javascript and CSS through the “Inspector” with its Breakpoint set. The web application should stop its working at this Breakpoint and show you “Variables” over at the right hand column of the “Inspector” window, showing you information that in many cases will lead to a solution to your bug … debugging goes with the word ohhhhhhhhh normally, and it is, a lot of the time, something pretty obvious in the end … it can even be to do with a critical misspelling, particularly with Javascript, being the non-compiled “interpretative” language that it is
- Once at a Breakpoint you might consider …
- Step In
- Step Over
… as other choices regarding stepping through the code one line of code at a time, perhaps to see some other (unexpected) thing about the code and/or the “Variables” to happen … and remember “Step Out” to finish with this mode of use
- Once at a Breakpoint you may also consider …
- Making another Breakpoint further into the code
- Click the Resume right arrow button
… is a good idea if you know the problem happens between Breakpoint A and Breakpoint B for instance
If this was interesting you may be interested in this too.


