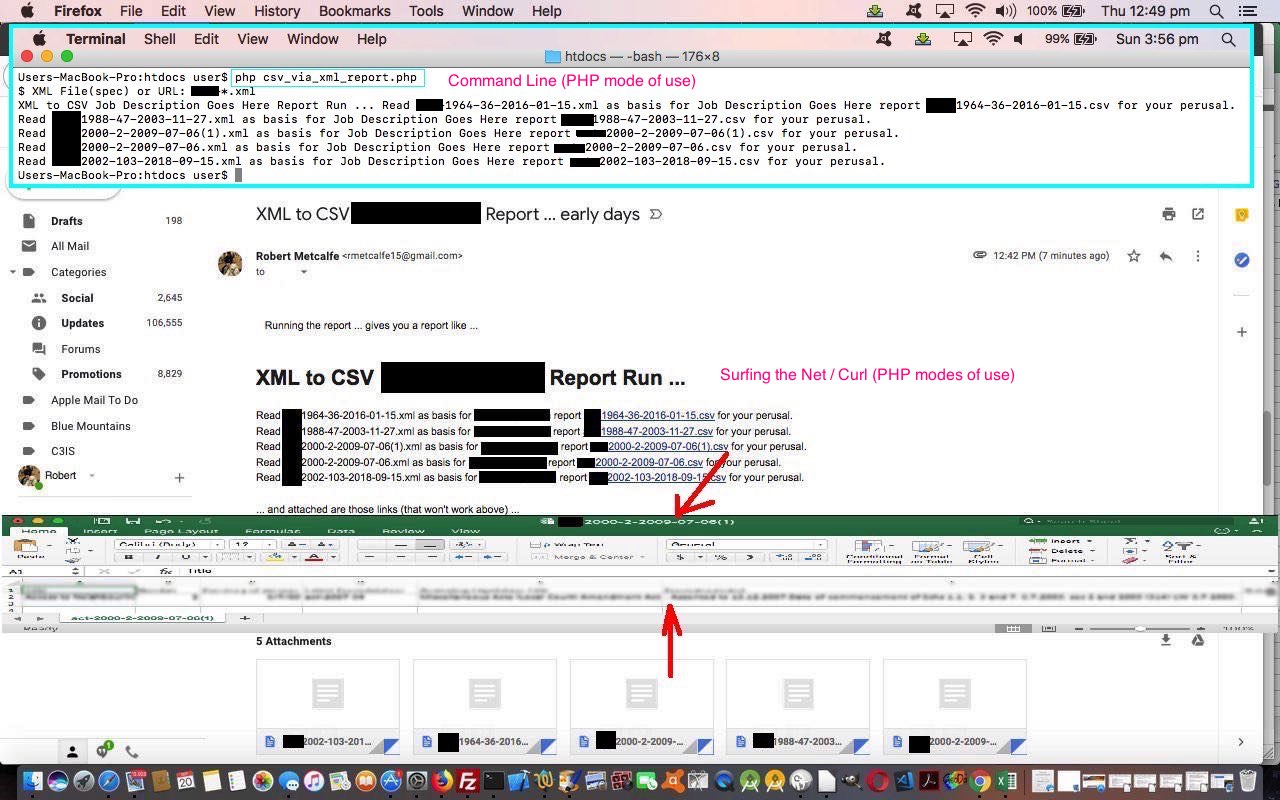
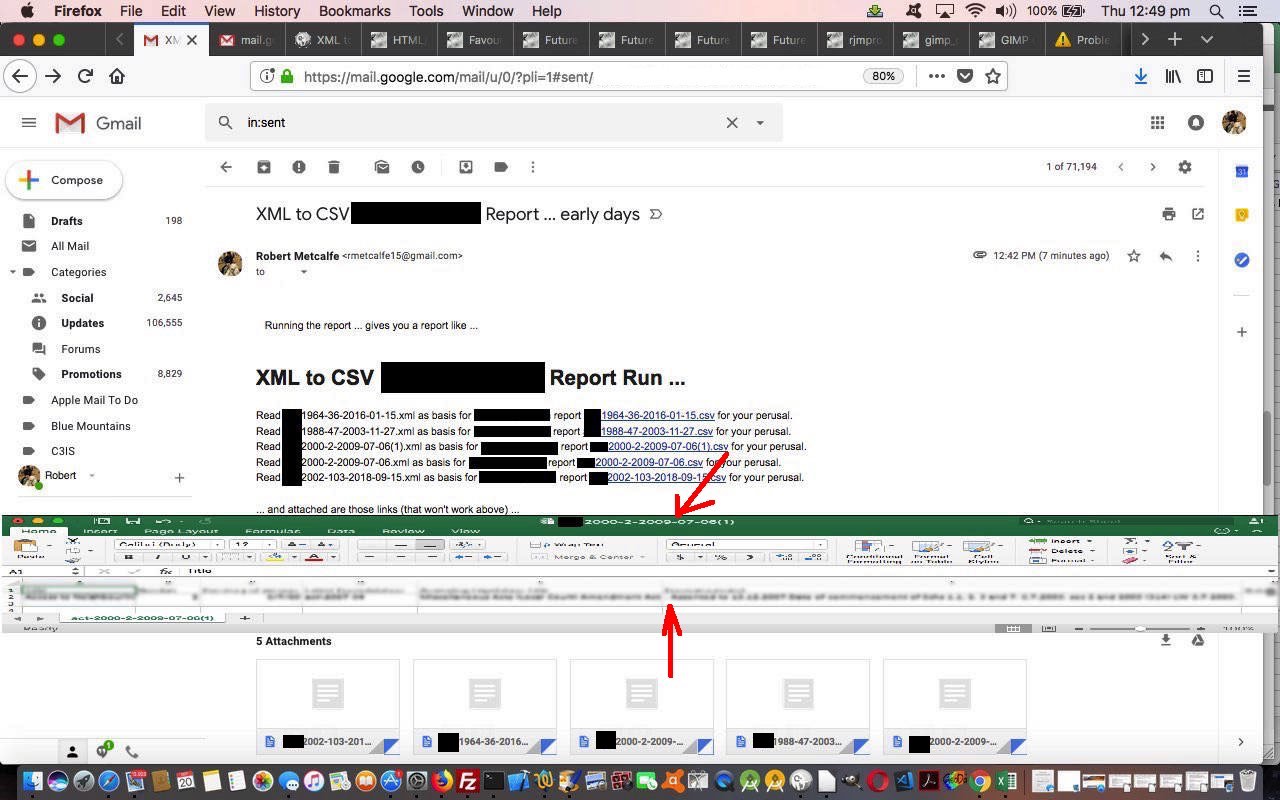
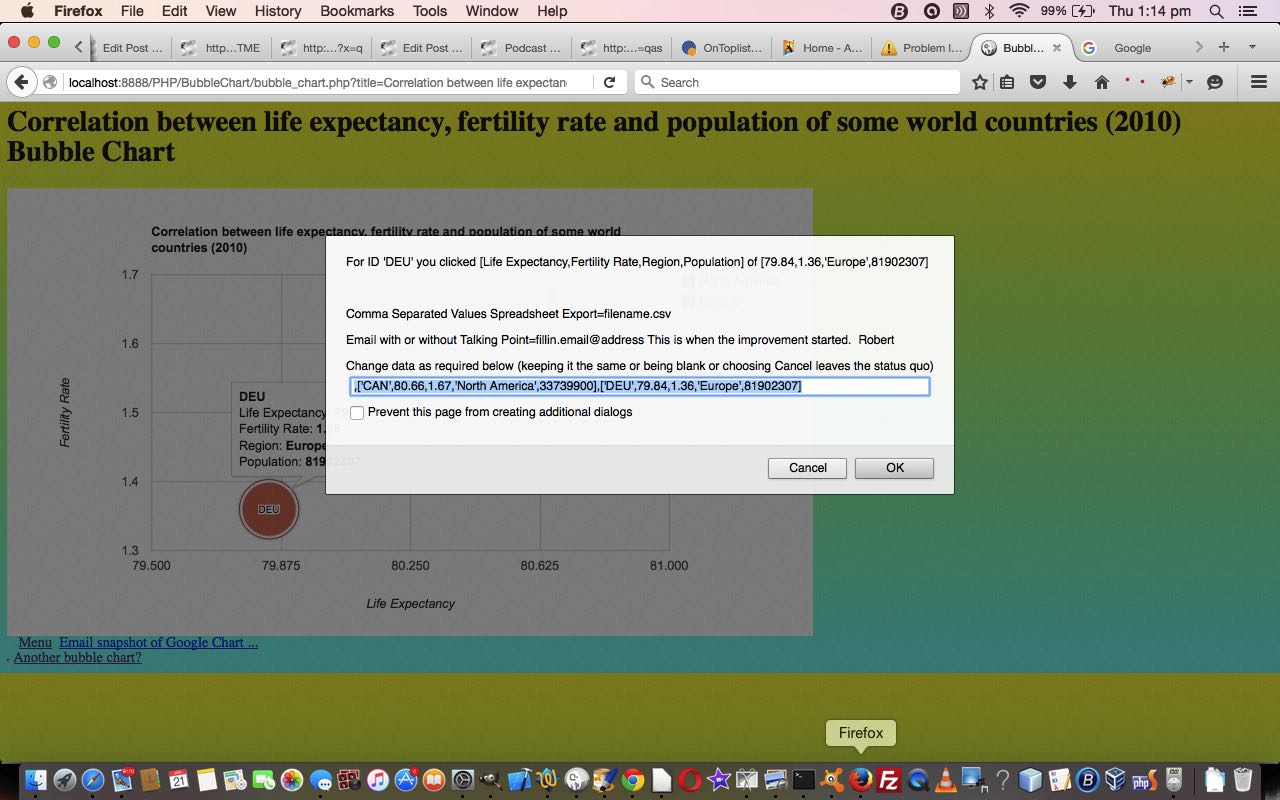
In terms of email sharing what are the advantages of an …
- email attachment solution … as distinct from a …
- body of email absolute URL link approach
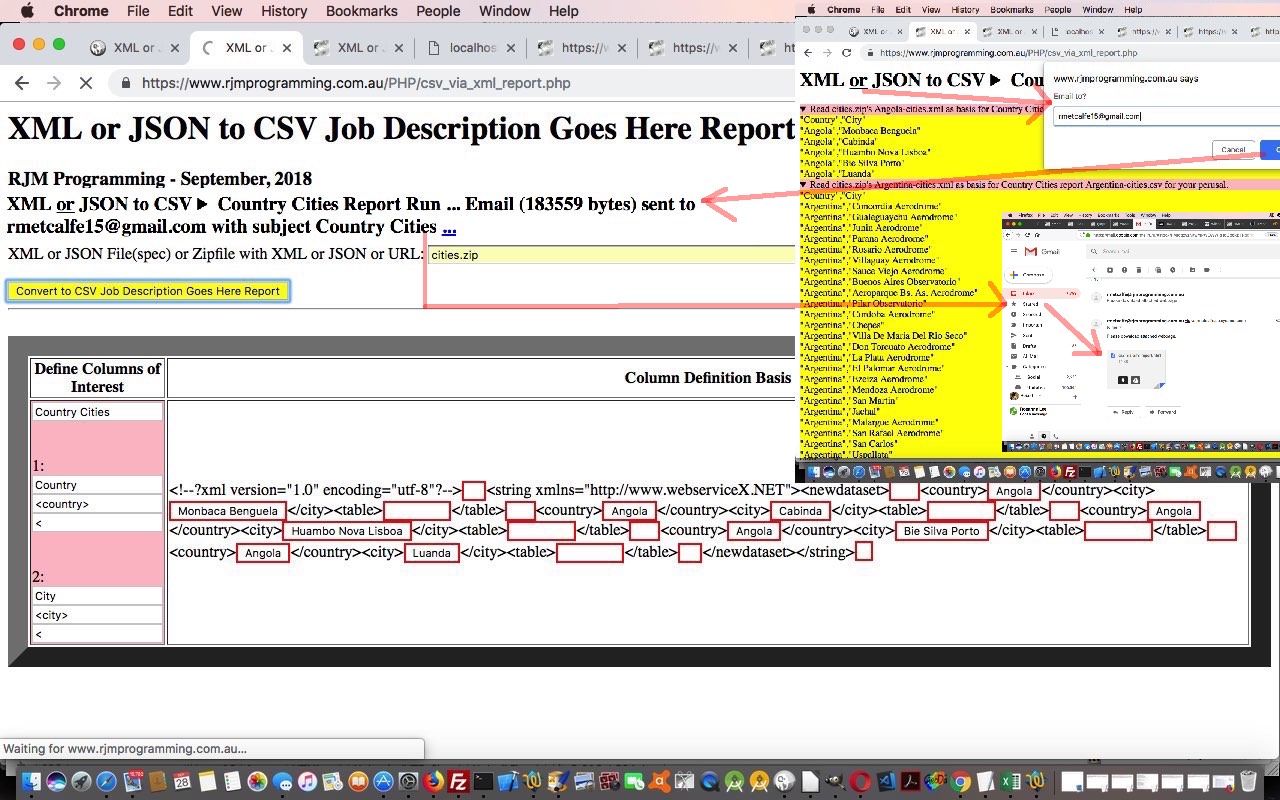
? Well, in brief, the former can bring the data along with it, as we showed a lot with the data URLs so prevalent in our Gimp Guillotine series of blog postings. There are also the email client suspicions of single link (within the body section) in emails, that they sometimes flag as spam. In terms of today’s continuation to yesterday’s JSON or XML to CSV Report Tutorial we’re interested in an email attachment that is that CSV report, which has no imagery, so what’s the big deal? Well well, web browsers other than Internet Explorer and Microsoft Edge (the lack of functionality of which we now cater for), ever since HTML5, offer the great “reveal” functionality of the details/summary combination of HTML usage, that makes for a dynamic report of much more interest for the reader, we reckon. Involve an email attachment, and this dynamism is a possibility, so in our books … and even our pamphlettes … we figure it’s worth it to offer this email attachment functionality, optionally, to the user, as a way to pass on a CSV (ie. spreadsheet) report along to another user, perhaps.
See how we did this email attachment work with a live run link for you to try this. The csv_via_xml_report.php PHP code got changed this way today.
Previous relevant JSON or XML to CSV Report Tutorial is shown below.
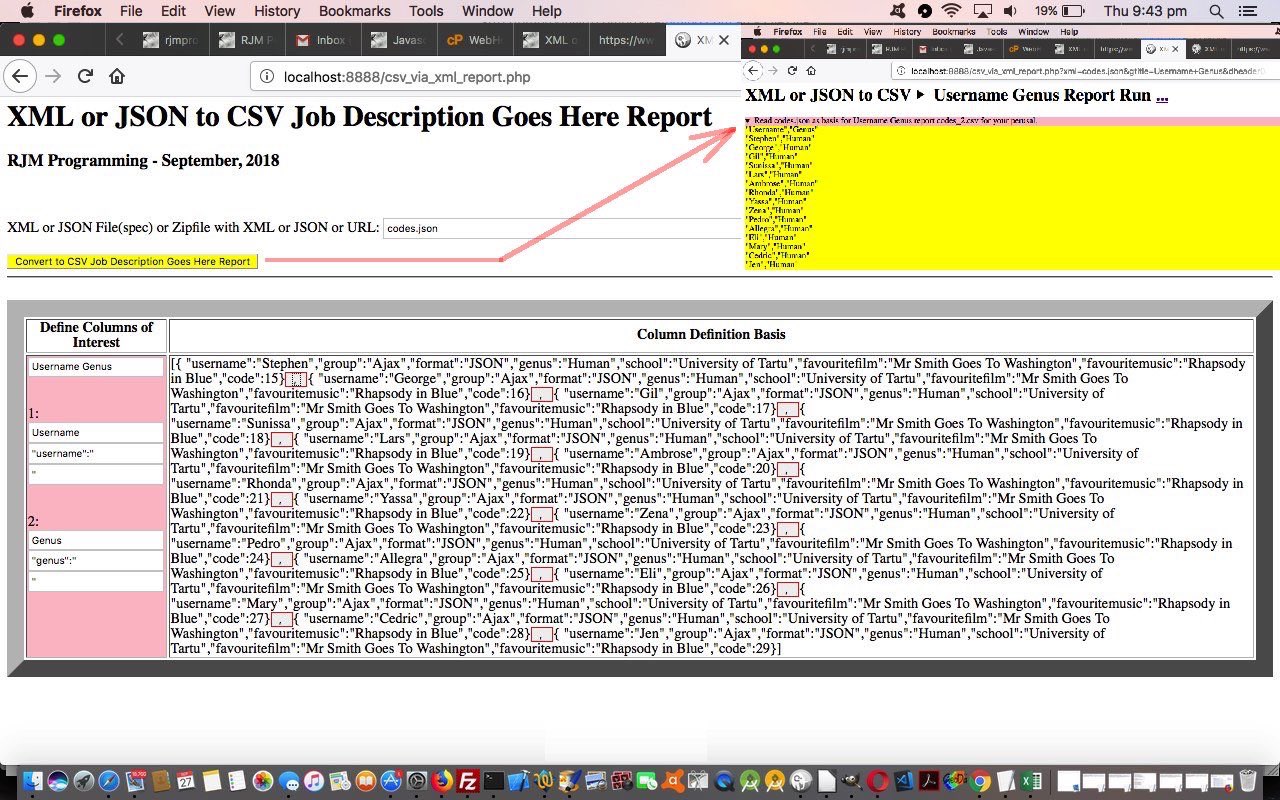
To add to the recent XML to CSV via Zip Command Line Report Tutorial‘s XML to CSV Report functionality, we’ve decided, today, to allow for JSON to be your alternative input file format …
In computing, JavaScript Object Notation or JSON (/ˈdʒeɪsən/ “jay-son”, /dʒeɪˈsɒn/)[1] is an open-standard file format that uses human-readable text to transmit data objects consisting of attribute–value pairs and array data types (or any other serializable value). It is a very common data format used for asynchronous browser–server communication, including as a replacement for XML in some AJAX-style systems.
… being as both JSON and XML …
In computing, Extensible Markup Language (XML) is a markup language that defines a set of rules for encoding documents in a format that is both human-readable and machine-readable. The W3C’s XML 1.0 Specification[2] and several other related specifications[3]—all of them free open standards—define XML.
… thanks Wikipedia … are huge players in the world of data, and sharing it with others. And you may want to add in SGML and XHTML into the mix and read this useful link, thanks, for the relationships here.
You visit a brilliant governmental data source website like data.gov and you will find JSON and XML downloads everywhere, so we’ve decided “to get with the plan” today, and join in.
See how we did this with a live run link for you to try this. The csv_via_xml_report.php PHP code got changed this way today for the new JSON (input file) interfacing functionality.
Previous relevant XML to CSV via Zip Command Line Report Tutorial is shown below.
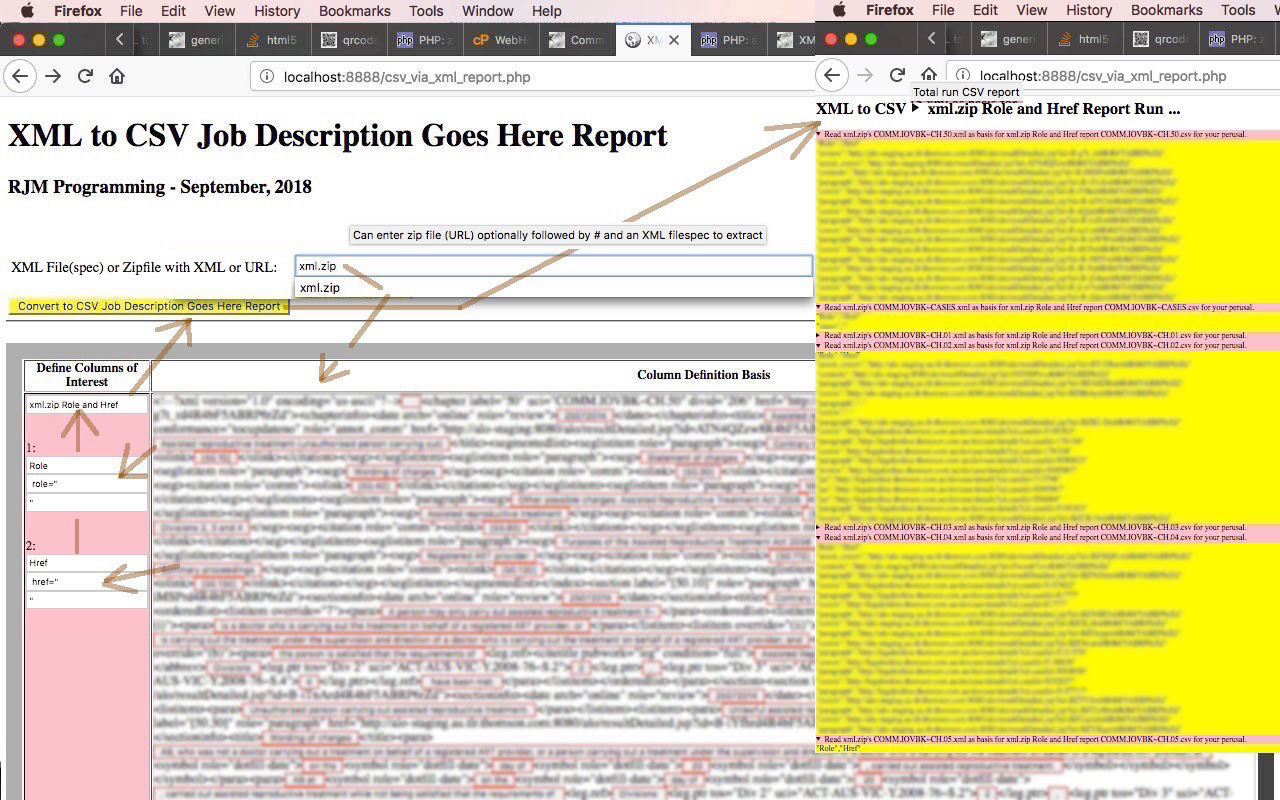
As we also thought recently with Gimp Guillotine Follow Up Zip Tutorial, the recent XML to CSV Report web application of XML to CSV Command Line Report Control Tutorial could have an “onions of the 4th dimension” type of facelift by allowing for Zipfile input functionality, something that PHP can help out with quite nicely, thank you very much.
And like we thought with that previous work we again reached for that …
In broad brush terms, how do you “slot in” zipfile functionality? Two PHP functions become “our[PHPfunctionName]”, those being …
… same function names … just different internals and usage pattern today …
- glob() sometimes becomes ourglob() …
 function ourglob($infil) {

   global $ziparr;

   if (isset($_GET['zipdata'])) {

     $ziparr = array();

     array_push($ziparr, $infil);

     return $ziparr;

   } else if (isset($_POST['zipdata'])) {

     $ziparr = array();

     array_push($ziparr, $infil);

     return $ziparr;

   } else {

     return glob($infil);

   }

 }
- file_get_contents() mostly becomes ourfile_get_contents() …
function ourfile_get_contents($infil) {
global $zdis;
if (isset($_GET['zipdata'])) {
if ($zdis == '') { $zdis=str_replace( "\r", " ", str_replace("\n"," ", str_replace('<','<', str_replace('>','>', str_replace("+"," ",urldecode($_GET['zipdata'])))))); }
return explode("!@!@!",explode(($infil . "@!@!@"), $zdis)[1])[0];
} else if (isset($_POST['zipdata'])) {
if ($zdis == '') { $zdis=str_replace( "\r", " ", str_replace("\n"," ", str_replace('<','<', str_replace('>','>', str_replace("+"," ",urldecode($_POST['zipdata'])))))); }
return explode("!@!@!",explode(($infil . "@!@!@"), $zdis)[1])[0];
} else {
return file_get_contents($infil);
}
}
… and this zip usage can be that cute one input file to one output webpage screen of CSV report information again “revealed” in details/summary elements, to help with scrolling navigation minimalization.
Does the zip functionality require more data? You bet it does, and as you can imagine, we change the form from method=GET to method=POST via (Javascript DOM) …
document.getElementById('myform').method='POST';
… (from the previous ‘GET’ setting (of the ? and & argument usage)) for these purposes, storing in addition to what has gone before, two more data items, those being …
- blank separated list of (PHP preg_matched) matching relevant XML files within the zip file entered in at the main textbox by the user … and …
- data item with (!@!@! separated) sets of …
- XML filename … separated by @!@!@ to …
- contents of that XML filename
This is what’s needed to join in, then, with yesterday’s work allowing for user defined delimitation, and then eventually click the main form’s submit button to create the CSV output report.
All this zip functionality being what it is, we can, again, show you a live run link for you to try this. The csv_via_xml_report.php PHP code got changed this way today. But new PHP was needed to effectively have an online “unzipper” webpage and that is the unzip.php PHP “child in iframe” code.
Did you want to try this? We’ve uploaded a cities.zip file with a small amount of Country Cities data in it. To try it …
- Click/touch live run
- Enter into the textbox “cities.zip” and tab out (or the equivalent) and wait for the table to be filled …
- The rest is in your hands, but we might suggest click/touch one of the “Angola” buttons and enter “<country>” as the prefixing delimiter and enter “Country” as that column’s title (and while you are there change job title to “Country Cites” maybe) and then click/touch the “Huambo Nova Lisboa” button and enter “<city>” as the prefixing delimiter and enter “City” as that column’s title …
- Click/touch the yellow submit button to create the CSV Report
Previous relevant XML to CSV Command Line Report Control Tutorial is shown below.
The recent XML to CSV Command Line Report Tutorial PHP serverside work at creating CSV Reports from XML input data featured no “live run” link, and at first we thought we’d end up …
- making PHP write PHP … until we preferred, for security reasons, to not allow this, and instead …
- controlled what PHP, behind the scenes gets written, that is user controlled, but limited as to what you can define, as per …
- job title … and sets of …
- column data title … with …
- column data prefixing delimitation … with …
- column data suffixing delimitation
- surfing the net … passing the “batch” feeling part of the job to …
- curl … that hybrid of web server (call) and command line environment modes … but left out …
- command line
- “isset($_GET[‘xml’])” now we should have “$gxml != ””
- “$_GET[‘xml’]” now we should have “$gxml”
- “isset($_POST[‘xml’])” now we should have “$pxml != ””
- “$_POST[‘xml’]” now we should have “$pxml”
- php csv_via_xml_report.php … where we glean via PHP’s readline a filespec of XML files, off the user
- php csv_via_xml_report.php XML-filespec*.xml // type of usage, where, at least with Linux, by the time this gets into the PHP “XML-filespec*.xml” will have been expanded into an $argv array captures command line argument string (part) looking like “XML-filespec1.xml XML-filespec2.xml XML-filespec3.xml XML-filespec4.xml”
- allow for “single file(spec)/(perhaps multiple) CSV report output file(s)” paradigm (via PHP’s glob function) … and using …
- PHP exec calling of curl … to achieve this … calling on the passing between two of our three PHP Modes of Use (surfing the web, curl, command line) concepts
$jobbits="Job Description Goes Here"; // fill this in// Start of business logic piecing together CSV report ...
$cont=file_get_contents($inxml);
$detailrec='';
$detailrec='"col1value","col2value"'; // you do more in depth work to get to this point via $contif (trim($detailrec) != "") {
$headerrec='"col1label","col2label"'; // you do more in depth work to get a header record as required via $cont
if ($outrpt != "" && 1 == 1) {
if ($headerrec != "") { $headerrec.="\n"; }
file_put_contents($outrpt, $headerrec . $detailrec);
exit;
} else {
if ($headerrec != "") { $headerrec.="<br>"; }
echo "<html><body><div>" . $headerrec . $detailrec . "</div></body></html>";
return null;
}
}
// End of business logic piecing together CSV report- XML input data functionality
- data column prefix or suffix exclusion (characters) allowing scope for numerical sorting of currency data for example
- Ajax call … and …
- XML local file browsed for
- supervisor CSV to Google Chart csv_to_bubblechart.htm‘s live run link web application changed this way … calls and uses …
- external Javascript csv_to_bubblechart.js changed this way
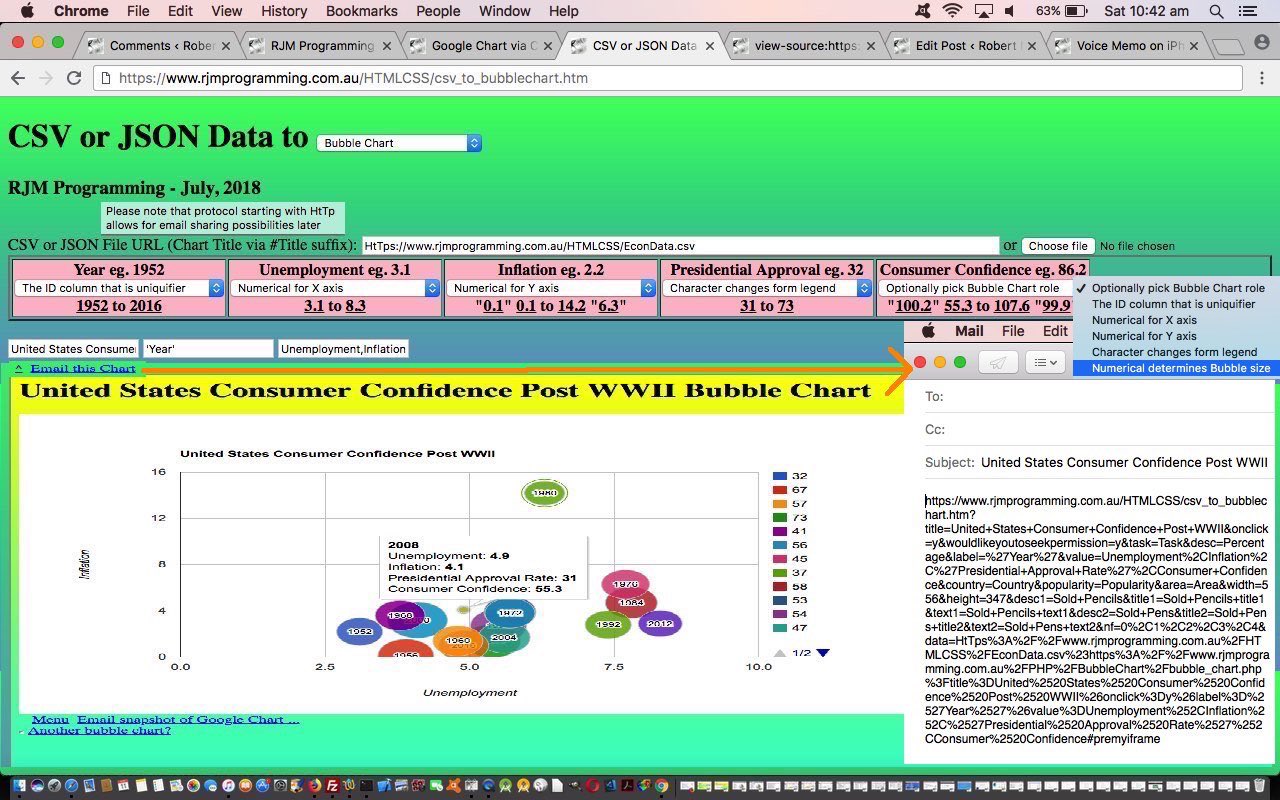
- email sharing of scenarios where your input CSV or JSON data is a URL via the user’s email client application means of emailing … and that long promised …
- correlation data examples for the Bubble Chart are shown today
- initial pass collects header information including, crucially, an input data URL arrangement that is started with “HtTp” the bother of using is the user’s way to flag that they may want to share the eventual output Google Chart via email (using the client email application … ie. “a” “mailto:” link) … that navigates to the same HTML and Javascript that has enough information to have a …
- second pass uses an Ajax approach to then fleshing out the “data” part to the whole issue, augmenting the header data passed in so as to be able to use HTML iframe element as an HTML form’s target=[iframeName] method=POST so that it can show the Google Chart asked for and be able to allow for emails that are making use of new HTML as per …
<div id=dpremyiframe><a id=premyiframe href='#myh1' title='Back to top'>^</a></div><br>
… to have the new Javascript DOM statement as per …
document.getElementById('dpremyiframe').innerHTML+=' <a id=aemail href="mailto:?subject=' + encodeURIComponent(document.getElementById('title').value) + '&body=' + encodeURIComponent(document.URL) + '" title="Email Chart">Email this Chart</a>';
… allow for this new email sharing functionality to happen - U.S. Consumer Confidence Post WWII Data Example //www.rjmprogramming.com.au/HTMLCSS/csv_to_bubblechart.htm?title=United+States+Consumer+Confidence+Post+WWII&onclick=y&wouldlikeyoutoseekpermission=y&task=Task&desc=Percentage&label=%27Year%27&value=Unemployment%2CInflation%2C%27Presidential+Approval+Rate%27%2CConsumer+Confidence&country=Country&popularity=Popularity&area=Area&width=556&height=347&desc1=Sold+Pencils&title1=Sold+Pencils+title1&text1=Sold+Pencils+text1&desc2=Sold+Pens&title2=Sold+Pens+title2&text2=Sold+Pens+text2&nf=0%2C1%2C2%2C3%2C4&data=HtTps%3A%2F%2Fwww.rjmprogramming.com.au%2FHTMLCSS%2FEconData.csv%23https%3A%2F%2Fwww.rjmprogramming.com.au%2FPHP%2FBubbleChart%2Fbubble_chart.php%3Ftitle%3DUnited%2520States%2520Consumer%2520Confidence%2520Post%2520WWII%26onclick%3Dy%26label%3D%2527Year%2527%26value%3DUnemployment%252CInflation%252C%2527Presidential%2520Approval%2520Rate%2527%252CConsumer%2520Confidence
- World Poverty Data Example //www.rjmprogramming.com.au/HTMLCSS/csv_to_bubblechart.htm?title=Female+Life+Expectancy+and+Birth+Rate+Correlation+to+GNP+Worldwide&onclick=y&wouldlikeyoutoseekpermission=y&task=Task&desc=Percentage&label=%27Country%27&value=Female+Life+Expectancy%2CBirth+Rate%2C%27Region%27%2CGNP&country=Country&popularity=Popularity&area=Area&width=556&height=347&desc1=Sold+Pencils&title1=Sold+Pencils+title1&text1=Sold+Pencils+text1&desc2=Sold+Pens&title2=Sold+Pens+title2&text2=Sold+Pens+text2&nf=7%2C4%2C0%2C6%2C5&data=HtTps%3A%2F%2Fwww.rjmprogramming.com.au%2FHTMLCSS%2FPoverty.csv%23https%3A%2F%2Fwww.rjmprogramming.com.au%2FPHP%2FBubbleChart%2Fbubble_chart.php%3Ftitle%3DFemale%2520Life%2520Expectancy%2520and%2520Birth%2520Rate%2520Correlation%2520to%2520GNP%2520Worldwide%26onclick%3Dy%26label%3D%2527Country%2527%26value%3DFemale%2520Life%2520Expectancy%252CBirth%2520Rate%252C%2527Region%2527%252CGNP
- supervisor CSV to Bubble Chart csv_to_bubblechart.htm‘s live run link web application changed this way … calls and uses …
- external Javascript csv_to_bubblechart.js needed no changes today
- alphabetical sorting … and sometimes also in terms of …
- numerical sorting … depending on the nature of the column data involved
- supervisor CSV to Bubble Chart csv_to_bubblechart.htm‘s live run link web application changed this way … calls and uses …
- external Javascript csv_to_bubblechart.js changed this way
- Area Chart
- Bar Chart
- Column Chart
- Line Chart
- supervisor CSV to Bubble Chart csv_to_bubblechart.htm‘s live run link web application changed this way … calls and uses …
- external Javascript csv_to_bubblechart.js changed this way
- header
- details
- chart title
- chart axis labelling
- chart legend wording
- chart menu wording (on the Annotated Timeline Chart for instance)
- change relevant type=hidden textboxes in the HTML form to type=text style=display:inline (so that they line up in one row across the screen below the column selectors, and the use of HTML input placeholder attributes we think does away with the need for labels)
- make sure the HTML form “action” attribute reflects any user changed textbox fields
- add an HTML form onsubmit event function that makes these textboxes disappear once the CSV columns of interest are decided upon
- add a user entered “?” for the “title” textbox be a mechanism to preview the Google Chart of interest that shows the (often) complex user interactivity possibilities for that Google Chart, so that the user can do this with that “title” textbox as well should they be more advanced users
- supervisor CSV to Bubble Chart csv_to_bubblechart.htm‘s live run link web application changed this way … calls and uses …
- external Javascript csv_to_bubblechart.js needed no changes today
- Bubble Chart
- Pie Chart
- Histogram Chart
- Map Chart
- Geo Chart
- Intensity Chart
- Area Chart
- Bar Chart
- Column Chart
- Line Chart
- Annotated Timeline Chart
- Calendar Chart
- Timeline Chart
- supervisor CSV to Bubble Chart csv_to_bubblechart.htm‘s live run link web application changed this way … calls and uses …
- external Javascript csv_to_bubblechart.js changed this way
- Bubble Chart
- Pie Chart
- Histogram Chart
- Map Chart
- Geo Chart
- Intensity Chart
- Area Chart
- Bar Chart
- Column Chart
- Line Chart
- supervisor CSV to Bubble Chart csv_to_bubblechart.htm‘s live run link web application changed this way … calls and uses …
- external Javascript csv_to_bubblechart.js changed this way
- ID (could be character data) … uniquifier
- X position on X axis
- Y position on Y axis
- Legend (character data, the different values of, can form the Bubble Chart legend)
- Sizer numerical value affects diameter of Bubble
- bubble_chart.php changes (to cater for select event (mobile touch) functionality) and live run link
- growth_of_merchandise_trade.php changes (to cater for select event (mobile touch) functionality) and live run link for yesterday’s web application
… the ol’ “button down approach” to security worries … try to be open but restrict to “billy oh'”, especially with serverside work where the user could write anything into a textarea for instance that it would be hard to trap all the sinful entries possible.
Where does all this new user entered data “sit”? Within the same form we’ve always used.
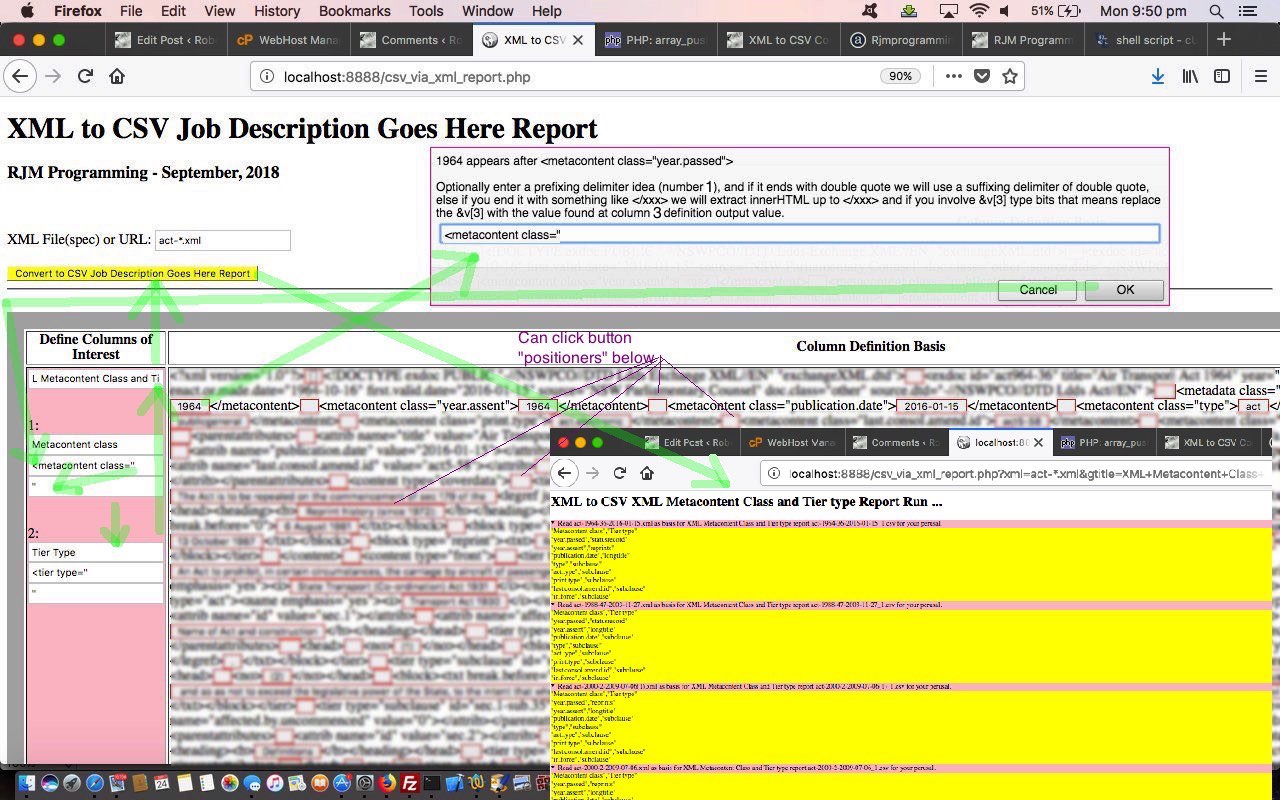
When do we intervene? We intervene on the major input type=text XML file(spec) text box at its onblur event (before the user clicks the form submit button should they be interested in tailoring the CSV Report output content this way), and set its cursor to “progress” while we present the first XML file into the right hand cell of an HTML table element created below the HTML form submit button. The left hand cell collects all those entries we talked about above, a new set “triggered” by clicking on any of the “innerHTML” (or “innerText”) input type=button elements in the right hand cell. We like to think of these buttons just as “positioners”, the clicking of which presenting the more important Javascript prompt window where we ask for a “prefixing delimitation” (usually enough to derive a suitable “suffixing delimiter”, though the user can override in the left hand cell at any time).
How does the PHP use the delimitation? Pretty simple really. For the third delimiter set …
the header record part is just the contents of the third "column data title" ... and the detail rows' column parts come from ...

explode([thirdSuffixingDelimiter], explode([thirdPrefixingDelimiter], file_get_contents([XMLfilename]))[1 + [rowNumberOfInterest]])[0]
The first presentation idea we’ve come up with for the user here is to present the CSV Report in “at first revealed” details/summary elements showing the CSV file, that the user can copy into the clipboard as they see fit, for all the CSV files involved in the reporting process.
All this being what it is, we can, at last show you a live run link for you to try this. The csv_via_xml_report.php PHP code got changed this way today.
Previous relevant XML to CSV Command Line Report Tutorial is shown below.
The recent XML to CSV Report Primer Tutorial referenced two of our Three PHP Modes of Use, they being …
… and so … you guessed it, non-robots … we are here today allowing for the same codebase to also work it for that “command line” PHP mode of use via …
php csv_via_xml_report.php [XML-filespec]
… and then, when it gets to the “batch” feeling bit, no “curl”, but a series of …
exec("php csv_via_xml_report.php XML-filename.xml");
… type calls. Why no “curl”? As much as anything because “curl” requires a URL as the first parameter, and to map a path to some PHP at the “command line” to a “curl” URL, even if possible, is not worth the risk of getting it wrong, so much better to do that recursive feeling “PHP command line everywhere” arrangement.
Which gives us another chance to show you some more angles on strategies, within the one PHP codebase, of differentiating a “surfing the net” scenario with a (PHP) “command line” mode of use scenario. Up the top, we gather most of this logic as per (the new) …
 $line='';

 $numargs=-1;

 $gxml="";

 $pxml="";

 $ziparr = array();


 function outin($inh) {

   global $numargs;

   if ($numargs <= 0) {

     return $inh;

   } else {

     $huhr='';

     $wo=false;

     $inh=str_replace("</title>","\n",str_replace("</p>","\n",str_replace("</tr>","\n",str_replace("<br>","\n",$inh))));

     for ($iu=0; $iu<strlen($inh); $iu++) {

       if (substr($inh, $iu, 1) == '>') {

         $wo=true;

       } else if (substr($inh, $iu, 1) == '<') {

         $wo=false;

       } else if ($wo) {

         $huhr.=substr($inh, $iu, 1);

       }

     }

     return $huhr;

   }

 }


 if (isset($_GET['xml'])) { // surfing the net

  $gxml=$_GET['xml'];

 } else if (isset($_POST['xml'])) { // surfing the net

  $pxml=$_POST['xml'];

 } else if (isset($argv)) { // command line

  $numargs = sizeof($argv);

  if ($numargs <= 1) {

   if (PHP_OS == 'WINNT') {

    echo '$ XML File(spec) or URL: ';

    $line = stream_get_line(STDIN, 1024, PHP_EOL);

   } else {

    $line = readline('$ XML File(spec) or URL: ');

   }

   $gxml=urlencode($line);

  } else {

   $gxml=$argv[1];

   array_push($ziparr, $argv[1]);

   for ($iu=2; $iu<$numargs; $iu++) {

    $gxml.=' ' . $argv[$iu];

    array_push($ziparr, $argv[$iu]);

   }

   $gxml=urlencode($gxml);

  }

 }
… to get to a point where in any code below this wherever we had …
… which just leaves one area of concern left (after just letting all those extra functionality $_GET[] and $_POST[] “smarts” in the code go through to the keeper for now, as far as “command line” usage goes (because they are not recognized in that mode of use)), that being the “batch” feeling bit. We have to cater for two “command line” usage scenarios, namely …
… the latter of which presents an unnatural fit for (good ol’) PHP glob, so we help glob out with lots of calls of it, each with a single file used, to help out with this quirky situation.
The other thing is with filenames that might contain special characters it is best expressing them on the command line PHP invocation surrounded by double quotes.
     if ($numargs >= 1) {

     exec("php " . $argv[0] . ' "' . $xmlfil . '"');

     } else {

     exec("curl " . "HTTP://" . $_SERVER['SERVER_NAME'] . ":" . $_SERVER['SERVER_PORT'] . explode("?",$_SERVER['REQUEST_URI'])[0] . '?xml=' . urlencode($xmlfil));

     }
Remember when this became the go all those years ago when DOS filename limit prefix08.ex3 got loosened to allow for longer filenames?
Notice above the PHP inhouse function “outin”? Why call it “outin”? Well, a bit like the HTML property “innerText” stripping out the caret’y bits that HTML surrounds the “data” with, to just give you the “data”, we think we are paring down the HTML elements’ outerHTML (look on a webpage within a web browser) to “innerText” (or innerHTMLs if you like) pared down (text) “data” that more suits a command line environment report requirement.
Seems a bit of a struggle, doesn’t it? Well, that could be me, but it is also (to do with) peeling back to what used to be. All desktop programs, before the days of the net and the GUIs (eg. Windows, Mac OS X), on the command line, used functions like PHP’s readline to glean interactively input data from users, and wait around for them to hit carriage return … ahhhhhhhhhhh … off to the next! Hope you can see the greater flexibility of webpage forms (perhaps a descendant of GUI dialog boxes), where a “whole lot of what is in store for the user” can be presented to the user, all at once … if your modern day user has not developed “form fatigue”, that is.
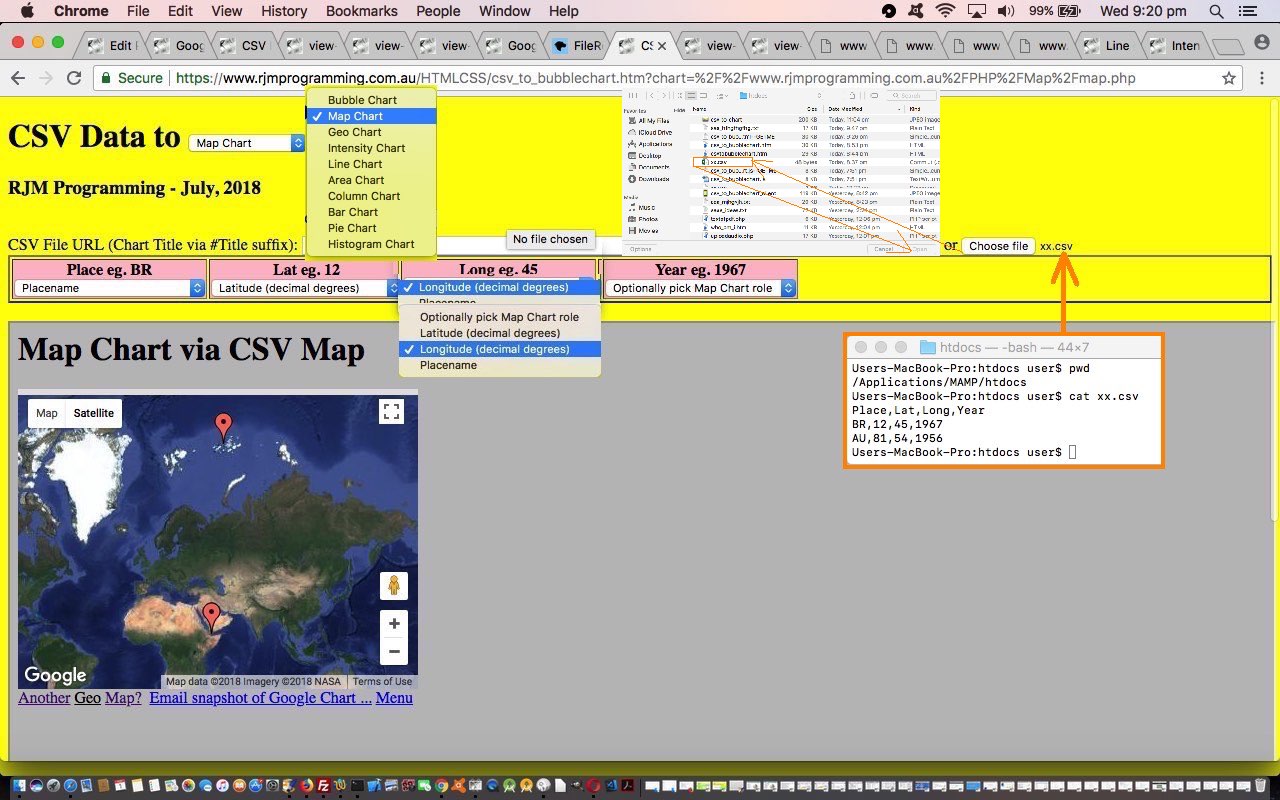
Our genericized csv_via_xml_report.php PHP code got “command line”d via today’s changes) and it still remains the case that we have no live run today, it best to say we would prefer you to download this yourself onto a local web server environment such as MAMP and proceed to do your thingthang. We hope you see what we mean with today’s tutorial picture synopsis of what we are talking about here.
Previous relevant XML to CSV Report Primer Tutorial is shown below.
Today, we’re building on the foundation of Google Chart via CSV or JSON or XML Tutorial‘s xml_to_csv.php PHP code to build a framework for an “XML to CSV [Job Description] Report” web application. This web application will add an “onions of the 4th dimension” on top of that previous “single file/single simplexml CSV output” paradigm by …
… the power of curl being it is less of a concern going to anything different environmentally when entering the “curl” world (from the “surfing the web” world). Mind you, this becomes a lot harder with more than one argument involved when using a Linux operating system because the “surfing the web” “&” usage does not go very kindly with the “&” “curl” (but in the command line as well) scenario where the “&” has a background process control meaning.
This is where PHP exec hanging around until finished is so useful, because we can check on how the processing went after the exec() call by checking for the existence of the predicted output filename, which is included in our genericized csv_via_xml_report.php PHP code (and how we got there from xml_to_csv.php) today (alas, we have no live run today, it best to say we would prefer you to download this yourself onto a local web server environment such as MAMP and proceed to do your thangthing). Nevertheless, see what we mean with today’s tutorial picture synopsis of what we are talking about here, where we can see there are three things for you to do, once downloaded, to get your own version of this code to “first unit test status” …
… and if it’s MAMP you are using, a unit test happens with a web browser address bar URL of …
HTTP://localhost:8888/csv_via_xml_report.php
We hope this is an idea you can apply to some XML data processing spreadsheet reporting job you have to do.
Previous relevant Google Chart via CSV or JSON or XML Tutorial is shown below.
Building on yesterday’s Google Chart via CSV or JSON Sharing Tutorial, again, we have a dual purpose set of improvements for you today regarding our CSV or JSON to Google Chart web application, those being …
We want to thank this great webpage for the heads up about the possibility to use PHP’s simplexml methodologies to convert XML data to CSV (in the simple and well formed data cases) that we’ve discussed before regarding a similar scenario with XML to HTML PHP Three Ways Translation Tutorial. In order to make all this happen for both …
… scenarios we needed to write a PHP XML to CSV converter called xml_to_csv.php which we show you in action below …
Allowing for character exclusions at the start or end of column data, to allow currency data be sorted (and filtered) numerically is just a case of offering a link that brings up a Javascript prompt box to ask the user for a whole of CSV or JSON or XML document file application of this character exclusion rule.
You can see both of these concepts playing out with the URL https://www.rjmprogramming.com.au/HTMLCSS/csv_to_bubblechart.htm?title=Breakfast+Menu&onclick=y&wouldlikeyoutoseekpermission=y&task=Price&desc=Calories&label=%27name%27&value=Life+Expectancy%2CFertility+Rate%2C%27Region%27%2CPopulation&country=Country&popularity=Popularity&area=Area&width=556&height=347&desc1=Sold+Pencils&title1=Sold+Pencils+title1&text1=Sold+Pencils+text1&desc2=Sold+Pens&title2=Sold+Pens+title2&text2=Sold+Pens+text2&nf=1%2C3&exclude=%24&data=HtTp%3A%2F%2Fwww.rjmprogramming.com.au%2FHTMLCSS%2Fbreakfast_menu.xml%23https%3A%2F%2Fwww.rjmprogramming.com.au%2FPHP%2FPieChart%2Fpie_chart.php%3Ftitle%3DPie%2520Chart%2520via%2520CSV%26onclick%3Dy%26task%3DTask%26desc%3DPercentage as shown live below …
So see what we did to get to where we are today …
Maybe you have some of your own CSV or JSON or XML data to show in chart form, yourself? We hope these ideas help you out.
Previous relevant Google Chart via CSV or JSON Sharing Tutorial is shown below.
Building on the recent Google Chart via CSV or JSON Filtering Tutorial we have a dual purpose set of improvements for you today regarding our CSV or JSON to Google Chart web application, that being …
You may know that whenever we talk about “user’s email client application” that means we are excluding PHP method=POST mail function approaches, and using, quite often large URLs (but not large enough to spill outside the URL length limits of the web server involved). How can we do this with the amounts of data involved? We break the issue into two parts …
Now let’s show you a couple of Bubble Chart data correlation ideas we are thankful to this great webpage for sharing.
So see what we did to get to where we are today after yesterday’s Google Chart Date Time Charts via CSV Tutorial …
Previous relevant Google Chart via CSV or JSON Filtering Tutorial is shown below.
One of the more challenging parts of data representation can be filtering out too much data, for presentation purposes. We are going to refer to this issue as a “filtering” issue.
Building on yesterday’s Google Chart via CSV or JSON Tutorial this filtering doesn’t care about the format of the data, just if the user is interested to apply it to any column of interest to them within a CSV (as the common denominator) column. As you can imagine, this involves reading through all the CSV data to arrive at some …
minimum range to maximum range
…. values for each column, always in terms of …
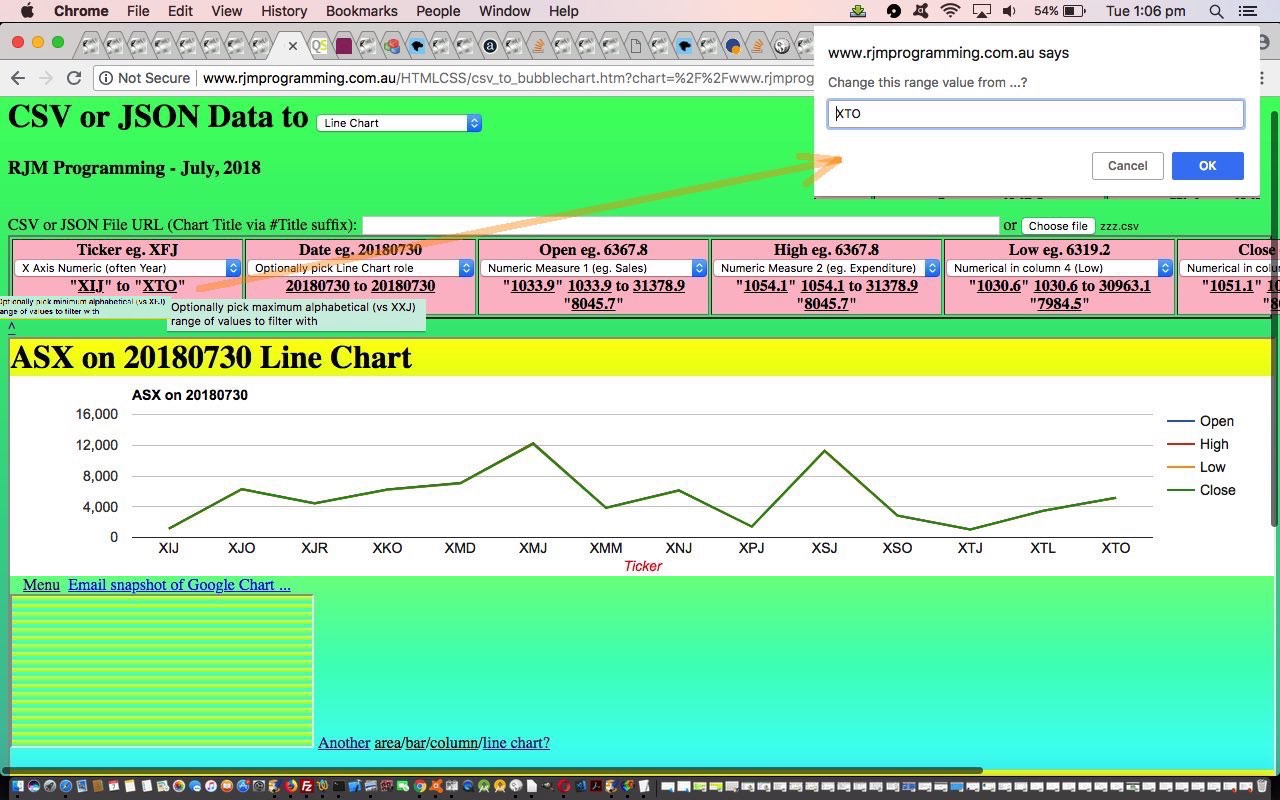
… and once collected, in a Javascript function called via a setTimeout timer so as not to interfere with the main workflow of the web application, we present to a user who hovers or clicks on a column dropdown “a” links to the up to 4 potential ranges of interest, ready for the user to redefine as they wish to “filter” data that goes to the Google Chart interfacer of interest.
Think the search engines, and they have algorithms to determine what shows above the fold for search results. This is a “filtering” mechanism they apply to a set of data too complex to present in a first come, first served way.
Again, see what we did to get to where we are today, below …
You can also see this play out at WordPress 4.1.1’s Google Chart via CSV or JSON Filtering Tutorial.
Previous relevant Google Chart via CSV or JSON Tutorial is shown below.
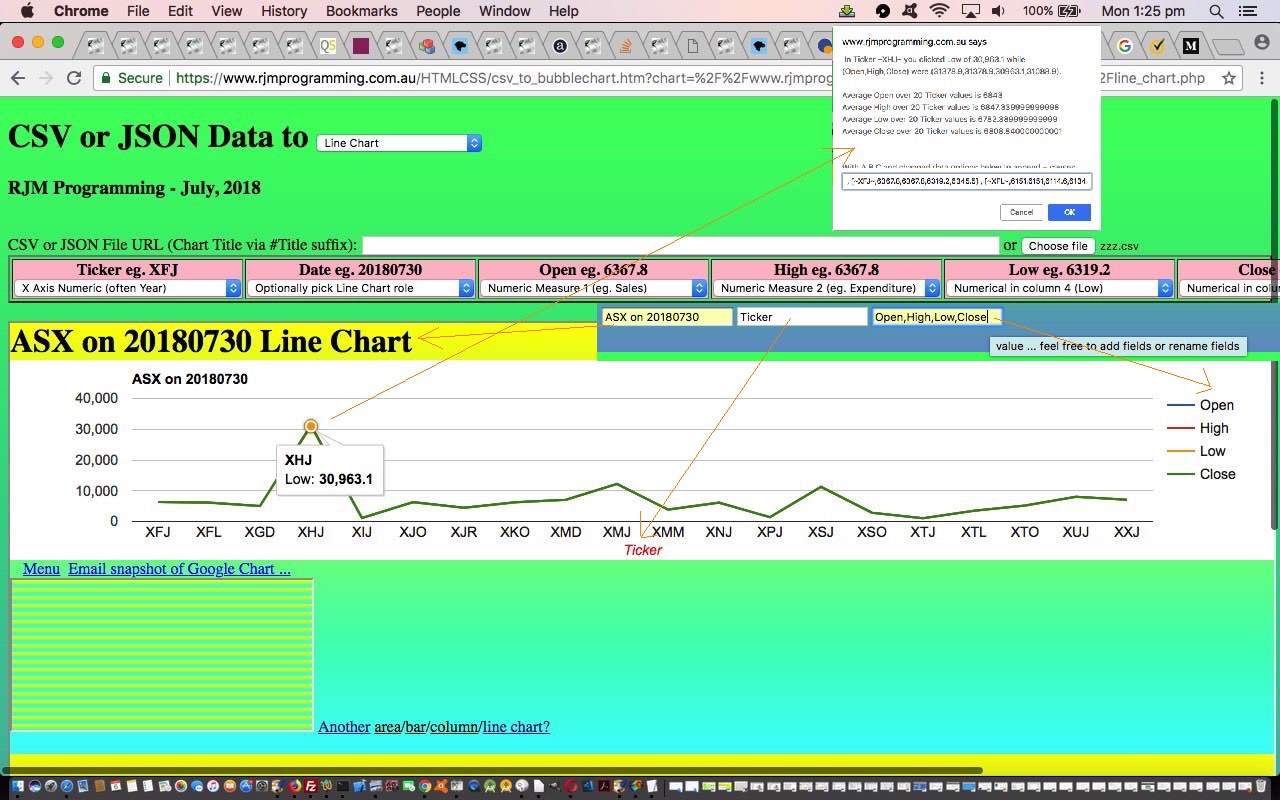
Our progression with the “CSV to Google Charts” web application today, building on yesterday’s Google Chart via CSV Header Data Tutorial, is to widen the net and name the web application “CSV or JSON to Google Charts”. The JSON protocol represents a common means by which hierarchical data can be represented in the online world. As such, though we cannot guarantee the more complex hierarchy of data found in JSON data, we thank the contributors to this great webpage for the all but tinkering Javascript function we end up with that converts JSON data to CSV for usage in our web application.
Also, today, now that we can edit header column data we can help out the “statistical” Google Charts …
… by allowing the user to add fields or rename fields of the default 3 fields expected by these chart types. With this, we expect any new such fields to be numerical.
The implication of this is that some quite complex scenarios can be reflected through the use of these chart types with this web application.
So see what we did to get to where we are today, below …
Thanks to the data of ASX Historical Data for the underpinnings of today’s Line Chart some ASX Stocks data on 20180730 tutorial picture.
Previous relevant Google Chart via CSV Header Data Tutorial is shown below.
Many jobs that involve data form themselves into a …
… data model. It happens all the time in Information Technology. Just think of General Ledgers in accounting. At the database table level supporting these arrangements there’ll be a smaller sized header table off which there will be a mechanism to “drill down” into the details database table.
In our current project, up until today, we’ve only taken a cursory interest in the “header” data thinking for it, offering only a pretty awkward and clunky mechanism for the user to enter a Google Chart title with that “#” method on the top textbox. In our priorities for this job we were much more focussed on how to deal with the larger volumes of data, and this is always associated with the “details” of the Google Chart data.
Within what we categorize into a “header” data categorization of the Google Chart data we would include …
… the data items needed to “personalize” (or “particularize”) the data into the “business logic” associated with the CSV data (or subset of that data, being as we can select columns of interest with our web application) of the job.
Behind the scenes even before today we’d hidden the “header” data into the HTML form (type=hidden) textboxes POSTed to the Google Chart interfacers, but today we …
So see what we did to get to where we are today after yesterday’s Google Chart Date Time Charts via CSV Tutorial …
Previous relevant Google Chart Date Time Charts via CSV Tutorial is shown below.
With the recent Google Chart More Charts via CSV Tutorial‘s CSV file interfacing to our interfacings to Google Charts …
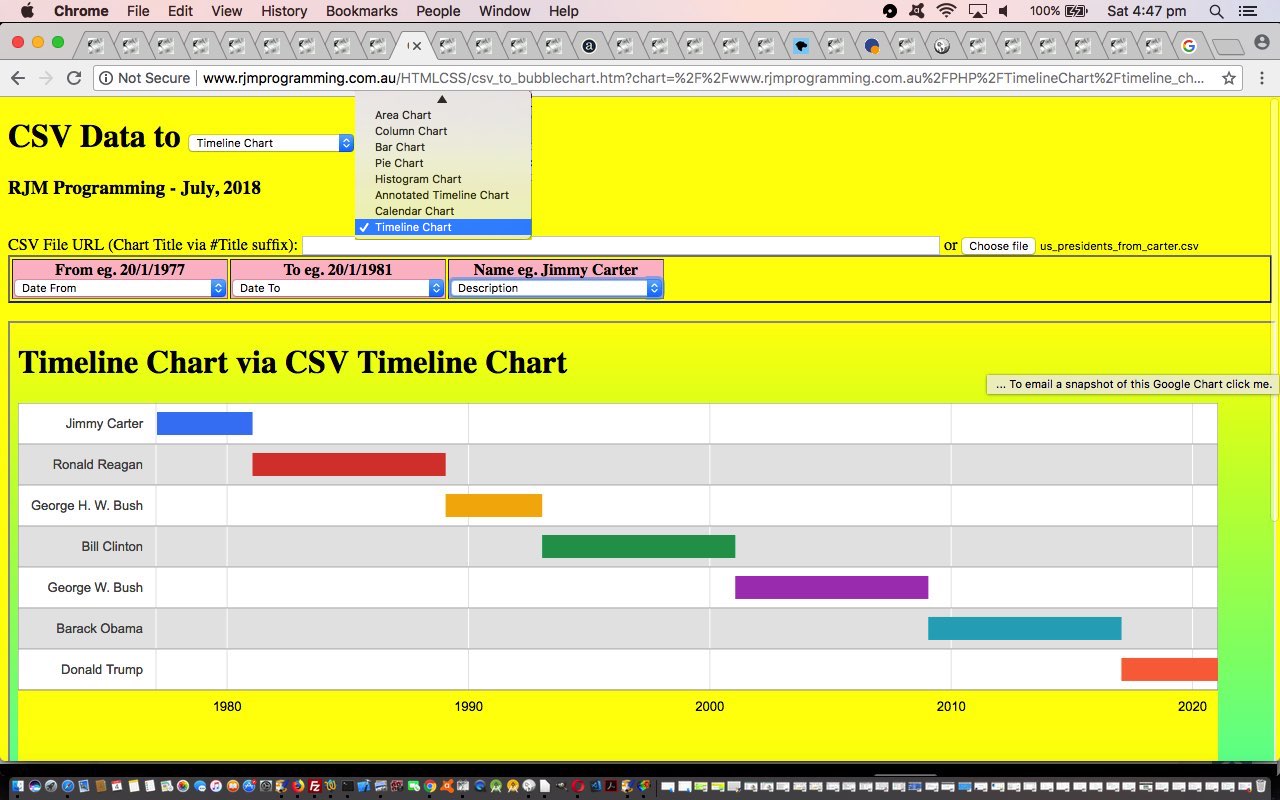
… did you notice a common theme, or perhaps a common non-theme?! Yes, none of the Google Charts above involved date nor datetime fields. So, today, we add …
… to the list, and so add some “when of life” interest to the potential for converting CSV data into meaningful chart data representations of that data.
You might wonder, “Where’s the complication there? Why didn’t this get scheduled earlier?” Well, like we’ve mentioned before at this blog, really appreciate the times when you, as the programmer, are in charge of the form of the data, but this job is not such a case, alas. We just do our best trying to imagine what might be thrown at the PHP (actually done in the Javascript client realms) as far as representing a date goes. Sadly though, there are many ways to represent a date, and we just try to imagine what is likely here. One difficult issue is the common way some countries represent dates in MM/DD/YYYY format. We like a default set of thinking that a user will use DD/MM/YYYY and if MM/DD/YYYY is being used, we hope the first instance of its use is one where the “DD” used is bigger than “12”, and we can know the date format being used is more likely to be MM/DD/YYYY. But please be aware there are many more delimiter and inhouse approaches that might pass by code that allows for date and/or datetime based data.
Later, at the interfacing to the Google Chart, the Google Chart wants dates or datetimes to be represented by a Date object (“constructor”). Plain sailing once you get to this, as long as one last quirk is attended to …
A date of 13 July 2018

 ... needs a Google Chart date "constructor" of the form ...

new Date(2018, 6, 13)
… Go Monthly DeficitFigure?!
As for the HTML and Javascript supervisors …
… interfacing to the changed Google Chart interfacer PHP code report HTTP://www.rjmprogramming.com.au/PHP/Geographicals/prediff.php?dpath=HTTP://www.rjmprogramming.com.au/&dfilespec=PHP/*/*.*GETME&dmdates=2018-08-04&dmdateb=2018-08-05 …
Previous relevant Google Chart More Charts via CSV Tutorial is shown below.
Yesterday’s Google Chart Bubble Chart via CSV Primer Tutorial set us up with a strategy to move forward today, so that by end of day we have CSV to Google Chart …
… interfacing functionalities in play, involving coding, unit testing and implementing …
PHP or HTML (supervisor) combination of non-“data*” named arguments transferred via $_GET[] (or $_SERVER[‘QUERY_STRING’] off the ? and & non-“data*” arguments of a form action=[URLPlusArguments] usage) ? and & argument calls (via HTML form enctype=application/x-www-urlencoded method=POST action=[(Google Chart interfacing) PHP]?title=etcetera) and $_POST[] (or php://input, or a blank such result then uses parent.document.getElementById(‘data’).value) “data*” arguments via HTML input “id=data name=data type=hidden” elements of a form enctype=application/x-www-urlencoded method=POSTed data …
//

// ... This scenario above results in $GETdata="";  // from that last code block above ... and so, then, further down ...

//

      echo ' function drawChart() { ' . "\n";

      if ($GETdata == "") {

      echo ' var wert="data=google.visualization.arrayToDataTable([ ' . ' [' . $GETlabel . ',' . $GETval . ']"; ' . "\n";

      echo " wert+=parent.document.getElementById('data').value.replace(/\~/g,\"'\").replace(/\'\'\'\'/g,\"''\"); " . "\n";

      echo ' wert+=" ])";' . "\n";

      echo ' eval(wert); ' . "\n";

      } else {

      echo ' data = google.visualization.arrayToDataTable([ ' . "\n";

      echo " [" . $GETlabel . "," . $GETval . "] \n";

      echo str_replace("''" . "''", "''", str_replace("~", "'", $GETdata));

      echo "        ]);\n";

      }

      echo "        var options = { \n";

      if (isset($hdgs[3])) {

      echo "        title: '" . $GETtitle . "', \n";

      echo "        hAxis: {title: '" . $hdgs[0] . "'}," . " \n";

      echo "        vAxis: {title: '" . $hdgs[1] . "'}," . " \n";

      echo "        bubble: {textStyle: {fontSize: 11}} \n";

      } else {

      echo "        colorAxis: {colors: ['yellow', 'red']} \n";

      }

      echo "       }; \n";
… which we discovered today worked for the $_GET[] bit but not for the $_POST[] nor php://input bits, but did for the parent.document.getElementById(‘data’).value idea on iOS mobile platform web browsers … and if cornered into the future we are yet to resort to …
… type changes for the Google Chart interfacers. As for the supervisors …
… they needed to follow patterns off the Bubble Chart “guinea pig” leads of the last couple of days.
Days of “consolidation” like this can build on “slog work”!
You can see Google Chart changes, today, via the report HTTP://www.rjmprogramming.com.au/PHP/Geographicals/prediff.php?dpath=HTTP://www.rjmprogramming.com.au/&dfilespec=PHP/*/*.*GETME&dmdates=2018-08-01&dmdateb=2018-08-02
Previous relevant Google Chart Bubble Chart via CSV Primer Tutorial is shown below.
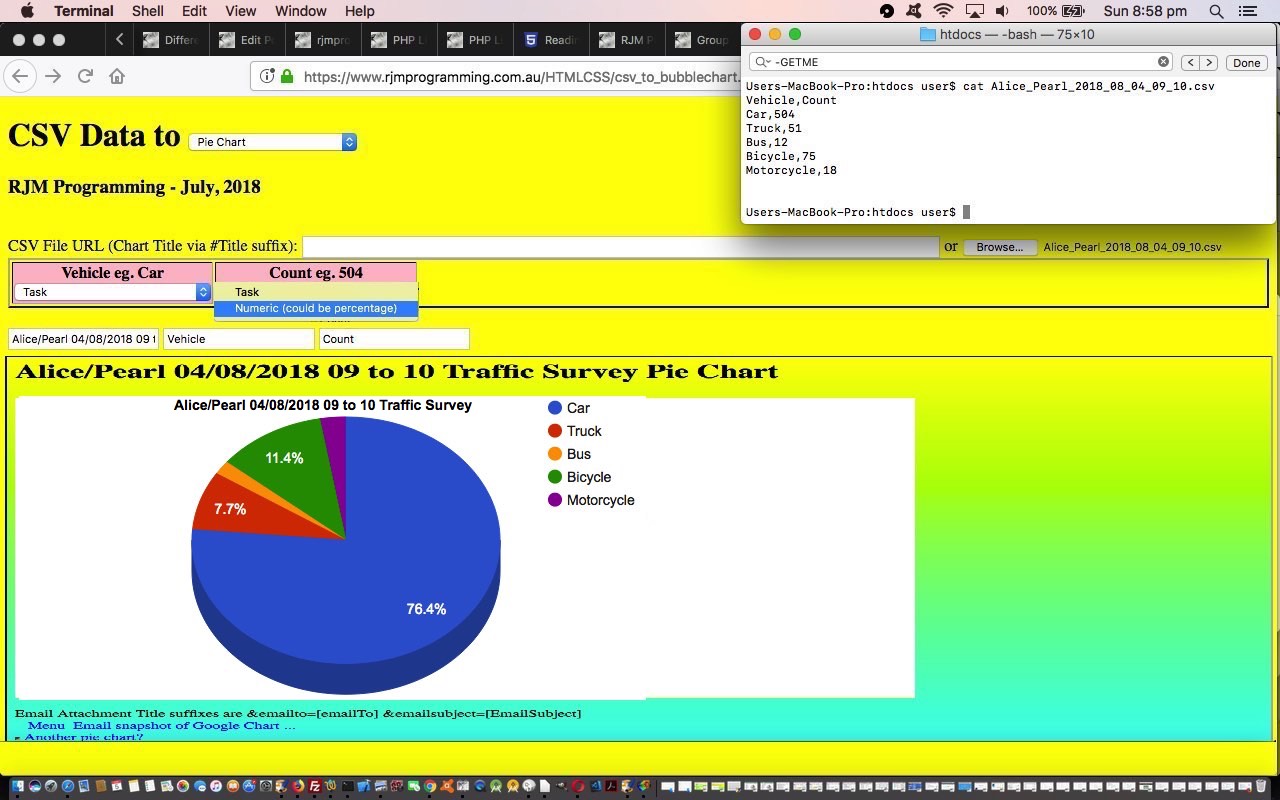
The Google Chart Bubble Chart is a great tool to show correlations, and we’ll get more on that soon, but today, we wanted to use it to display some more United States data resource website data.gov derived data regarding “First Names of Babies in New York from 2011 to 2014”, as you can see happening in today’s tutorial picture.
Google Chart Bubble Charts can handle 5 data properties as per …
… for each data point. Later, in today’s CSV to Bubble Chart csv_to_bubblechart.html‘s live run link web application these data property choices make up the options of HTML select (dropdown) elements associated with each CSV (ie. comma separated values format) column where the user can assign a CSV column with a Bubble Chart “data property” role, and so give the web application a means by which to create the Bubble Chart, created after 5 of these dropdowns are given values.
A CSV file URL completes the user data requirements here. We thank this useful link, thanks, for good Ajax Javascript code to avoid a CSV being downloaded (as happens a lot when setting a CSV as an HTML iframe element ‘src’ property value).
The external Javascript today is csv_to_bubblechart.js completing the supervisory code team for the HTML iframe child Google Chart Bubble Chart interfacing bubble_chart.php changed this way for today’s work.
You can enter your own data here or simulate today’s tutorial picture. There’s more to work on here, we’re thinking, and we hope you find this interesting.
Previous relevant Google Chart Bubble Chart Select Event Primer Tutorial is shown below.
Maybe you tried yesterday’s Worldbank data web application (via PHP Worldbank Growth of Merchandise Trade Tutorial) on a mobile device and tried to zero in on a bubble … zero, bubble … guess you had to be there … and got so disappointed with the “dead fish” response that you ignored the vegemite sandwich for lunch, which caused a butterfly in Brazil to heave a huge sigh … the world headlines followed … but you have my complete discretion on this!
Anyway … for those inquisitive mobile users out there interested in Worldbank trade figures … please, not all at once … let’s get Google Chart Bubble Charts working for their Select event, which is like a mobile touch event, while not interfering with the usual vegemite eating habits of your average laptop user … vege UP . vege DOWN . my body is a wigwam . my body is a teepee . aside (to gobsmacked audience with mouths open 😲): “patently they’re twoo tentsse”.
Software wise our new Google Chart Bubble Chart (Select event) integration involved …
Link to Google Chart Tools “spiritual home” … via Google.
Link to Google Chart Bubble Charts information … via Google.
This extra ‘select’ event functionality, available via the suffix “&onclick=y” applied to the Google Chart Bubble Chart title, flows on directly to the iPad iOS App we created and talked about, last, with Xcode Swift iOS Application End Game Primer Tutorial.
So please try creating your own emailable Google Chart live run for …
If this was interesting you may be interested in this too.
If this was interesting you may be interested in this too.
If this was interesting you may be interested in this too.
If this was interesting you may be interested in this too.
If this was interesting you may be interested in this too.
If this was interesting you may be interested in this too.
If this was interesting you may be interested in this too.
If this was interesting you may be interested in this too.
If this was interesting you may be interested in this too.
If this was interesting you may be interested in this too.
If this was interesting you may be interested in this too.
If this was interesting you may be interested in this too.
If this was interesting you may be interested in this too.
If this was interesting you may be interested in this too.
If this was interesting you may be interested in this too.

