The Google Chart Bubble Chart is a great tool to show correlations, and we’ll get more on that soon, but today, we wanted to use it to display some more United States data resource website data.gov derived data regarding “First Names of Babies in New York from 2011 to 2014″, as you can see happening in today’s tutorial picture.
Google Chart Bubble Charts can handle 5 data properties as per …
- ID (could be character data) … uniquifier
- X position on X axis
- Y position on Y axis
- Legend (character data, the different values of, can form the Bubble Chart legend)
- Sizer numerical value affects diameter of Bubble
… for each data point. Later, in today’s CSV to Bubble Chart csv_to_bubblechart.html‘s live run link web application these data property choices make up the options of HTML select (dropdown) elements associated with each CSV (ie. comma separated values format) column where the user can assign a CSV column with a Bubble Chart “data property” role, and so give the web application a means by which to create the Bubble Chart, created after 5 of these dropdowns are given values.
A CSV file URL completes the user data requirements here. We thank this useful link, thanks, for good Ajax Javascript code to avoid a CSV being downloaded (as happens a lot when setting a CSV as an HTML iframe element ‘src’ property value).
The external Javascript today is csv_to_bubblechart.js completing the supervisory code team for the HTML iframe child Google Chart Bubble Chart interfacing bubble_chart.php changed this way for today’s work.
You can enter your own data here or simulate today’s tutorial picture. There’s more to work on here, we’re thinking, and we hope you find this interesting.
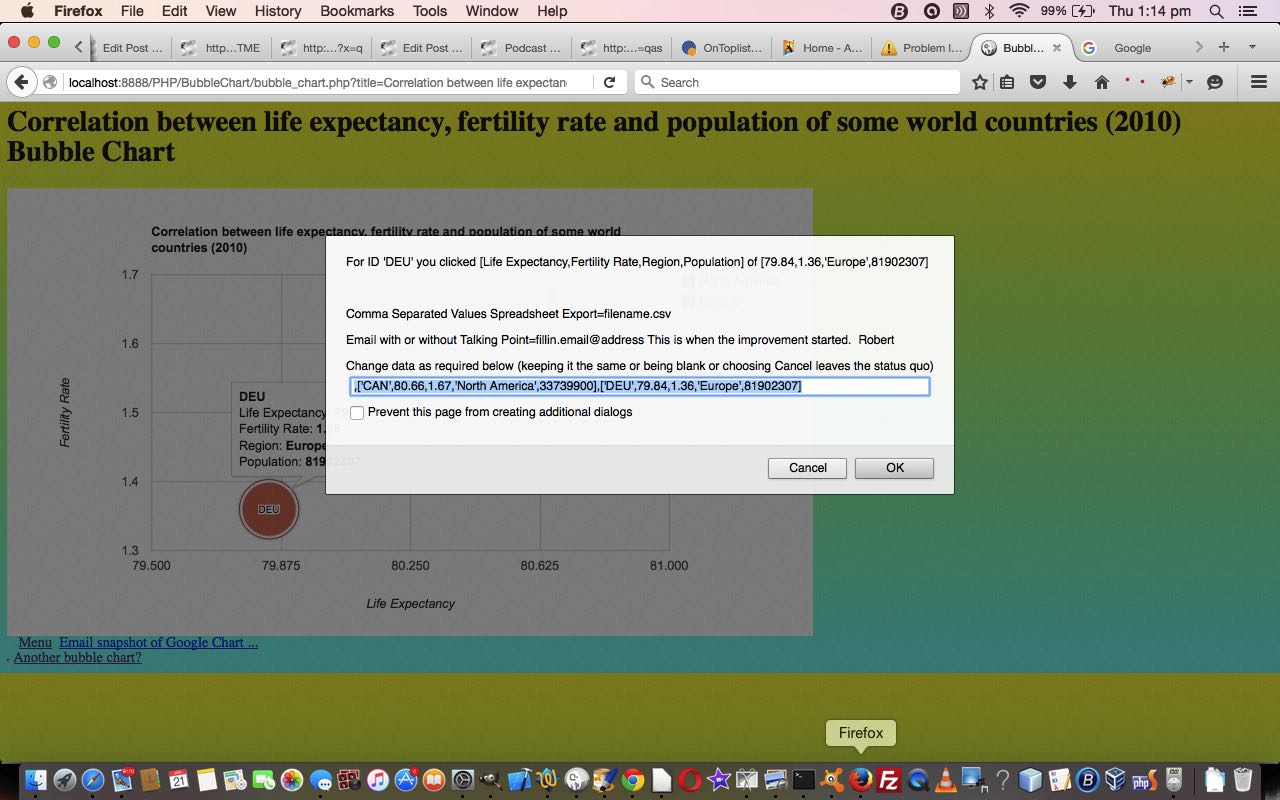
Previous relevant Google Chart Bubble Chart Select Event Primer Tutorial is shown below.
Maybe you tried yesterday’s Worldbank data web application (via PHP Worldbank Growth of Merchandise Trade Tutorial) on a mobile device and tried to zero in on a bubble … zero, bubble … guess you had to be there … and got so disappointed with the “dead fish” response that you ignored the vegemite sandwich for lunch, which caused a butterfly in Brazil to heave a huge sigh … the world headlines followed … but you have my complete discretion on this!
Anyway … for those inquisitive mobile users out there interested in Worldbank trade figures … please, not all at once … let’s get Google Chart Bubble Charts working for their Select event, which is like a mobile touch event, while not interfering with the usual vegemite eating habits of your average laptop user … vege UP . vege DOWN . my body is a wigwam . my body is a teepee . aside (to gobsmacked audience with mouths open 😲): “patently they’re twoo tentsse”.
Software wise our new Google Chart Bubble Chart (Select event) integration involved …
- bubble_chart.php changes (to cater for select event (mobile touch) functionality) and live run link
- growth_of_merchandise_trade.php changes (to cater for select event (mobile touch) functionality) and live run link for yesterday’s web application
Link to Google Chart Tools “spiritual home” … via Google.
Link to Google Chart Bubble Charts information … via Google.
This extra ‘select’ event functionality, available via the suffix “&onclick=y” applied to the Google Chart Bubble Chart title, flows on directly to the iPad iOS App we created and talked about, last, with Xcode Swift iOS Application End Game Primer Tutorial.
So please try creating your own emailable Google Chart live run for …
If this was interesting you may be interested in this too.
If this was interesting you may be interested in this too.


