Do the words “outlier” and “clutter” have an association for you?
The work of yesterday’s PHP Worldbank Growth of Merchandise Trade Emoji Flags Tutorial got us to first think about “clutter”, because it was hard to get to some data points, especially in the “S” section of “Growth of Merchandise Trade” data Bubble Charts, because of “clutter”.
But then, it occurred to us, this being a “data” related subject, that …
outlier values can contribute to data clutter
… in the fields of “statistics” (as well as other scientific and mathematical fields (but not “outstanding in their own field”)
) and “graphical data representation” the presence of “outlier” values can skew a representation of all data values so that, just with the peloton in a cycling race deciding whether to bridge the gap to an “outlier” breakaway leader cyclist, it gets “cluttered”.
Say the word “clutter” and the reaction with people is debatable. What is not debatable is that given the opportunity, some people like a mechanism to get through “clutter” to see (the essence of) what lies beneath. Maybe what isn’t debatable about humans, especially early on, is our capacity for curiosity? Anyway, yesterday’s work got us to delving into Google Chart Bubble Chart documentation (specifically the Options section), where we found an experimental functionality Google refers to as “explorer” that allows for …
The Google Charts explorer supports three actions:
dragToPan: Drag to pan around the chart horizontally and vertically. To pan only along the horizontal axis, use explorer: { axis: ‘horizontal’ }. Similarly for the vertical axis.
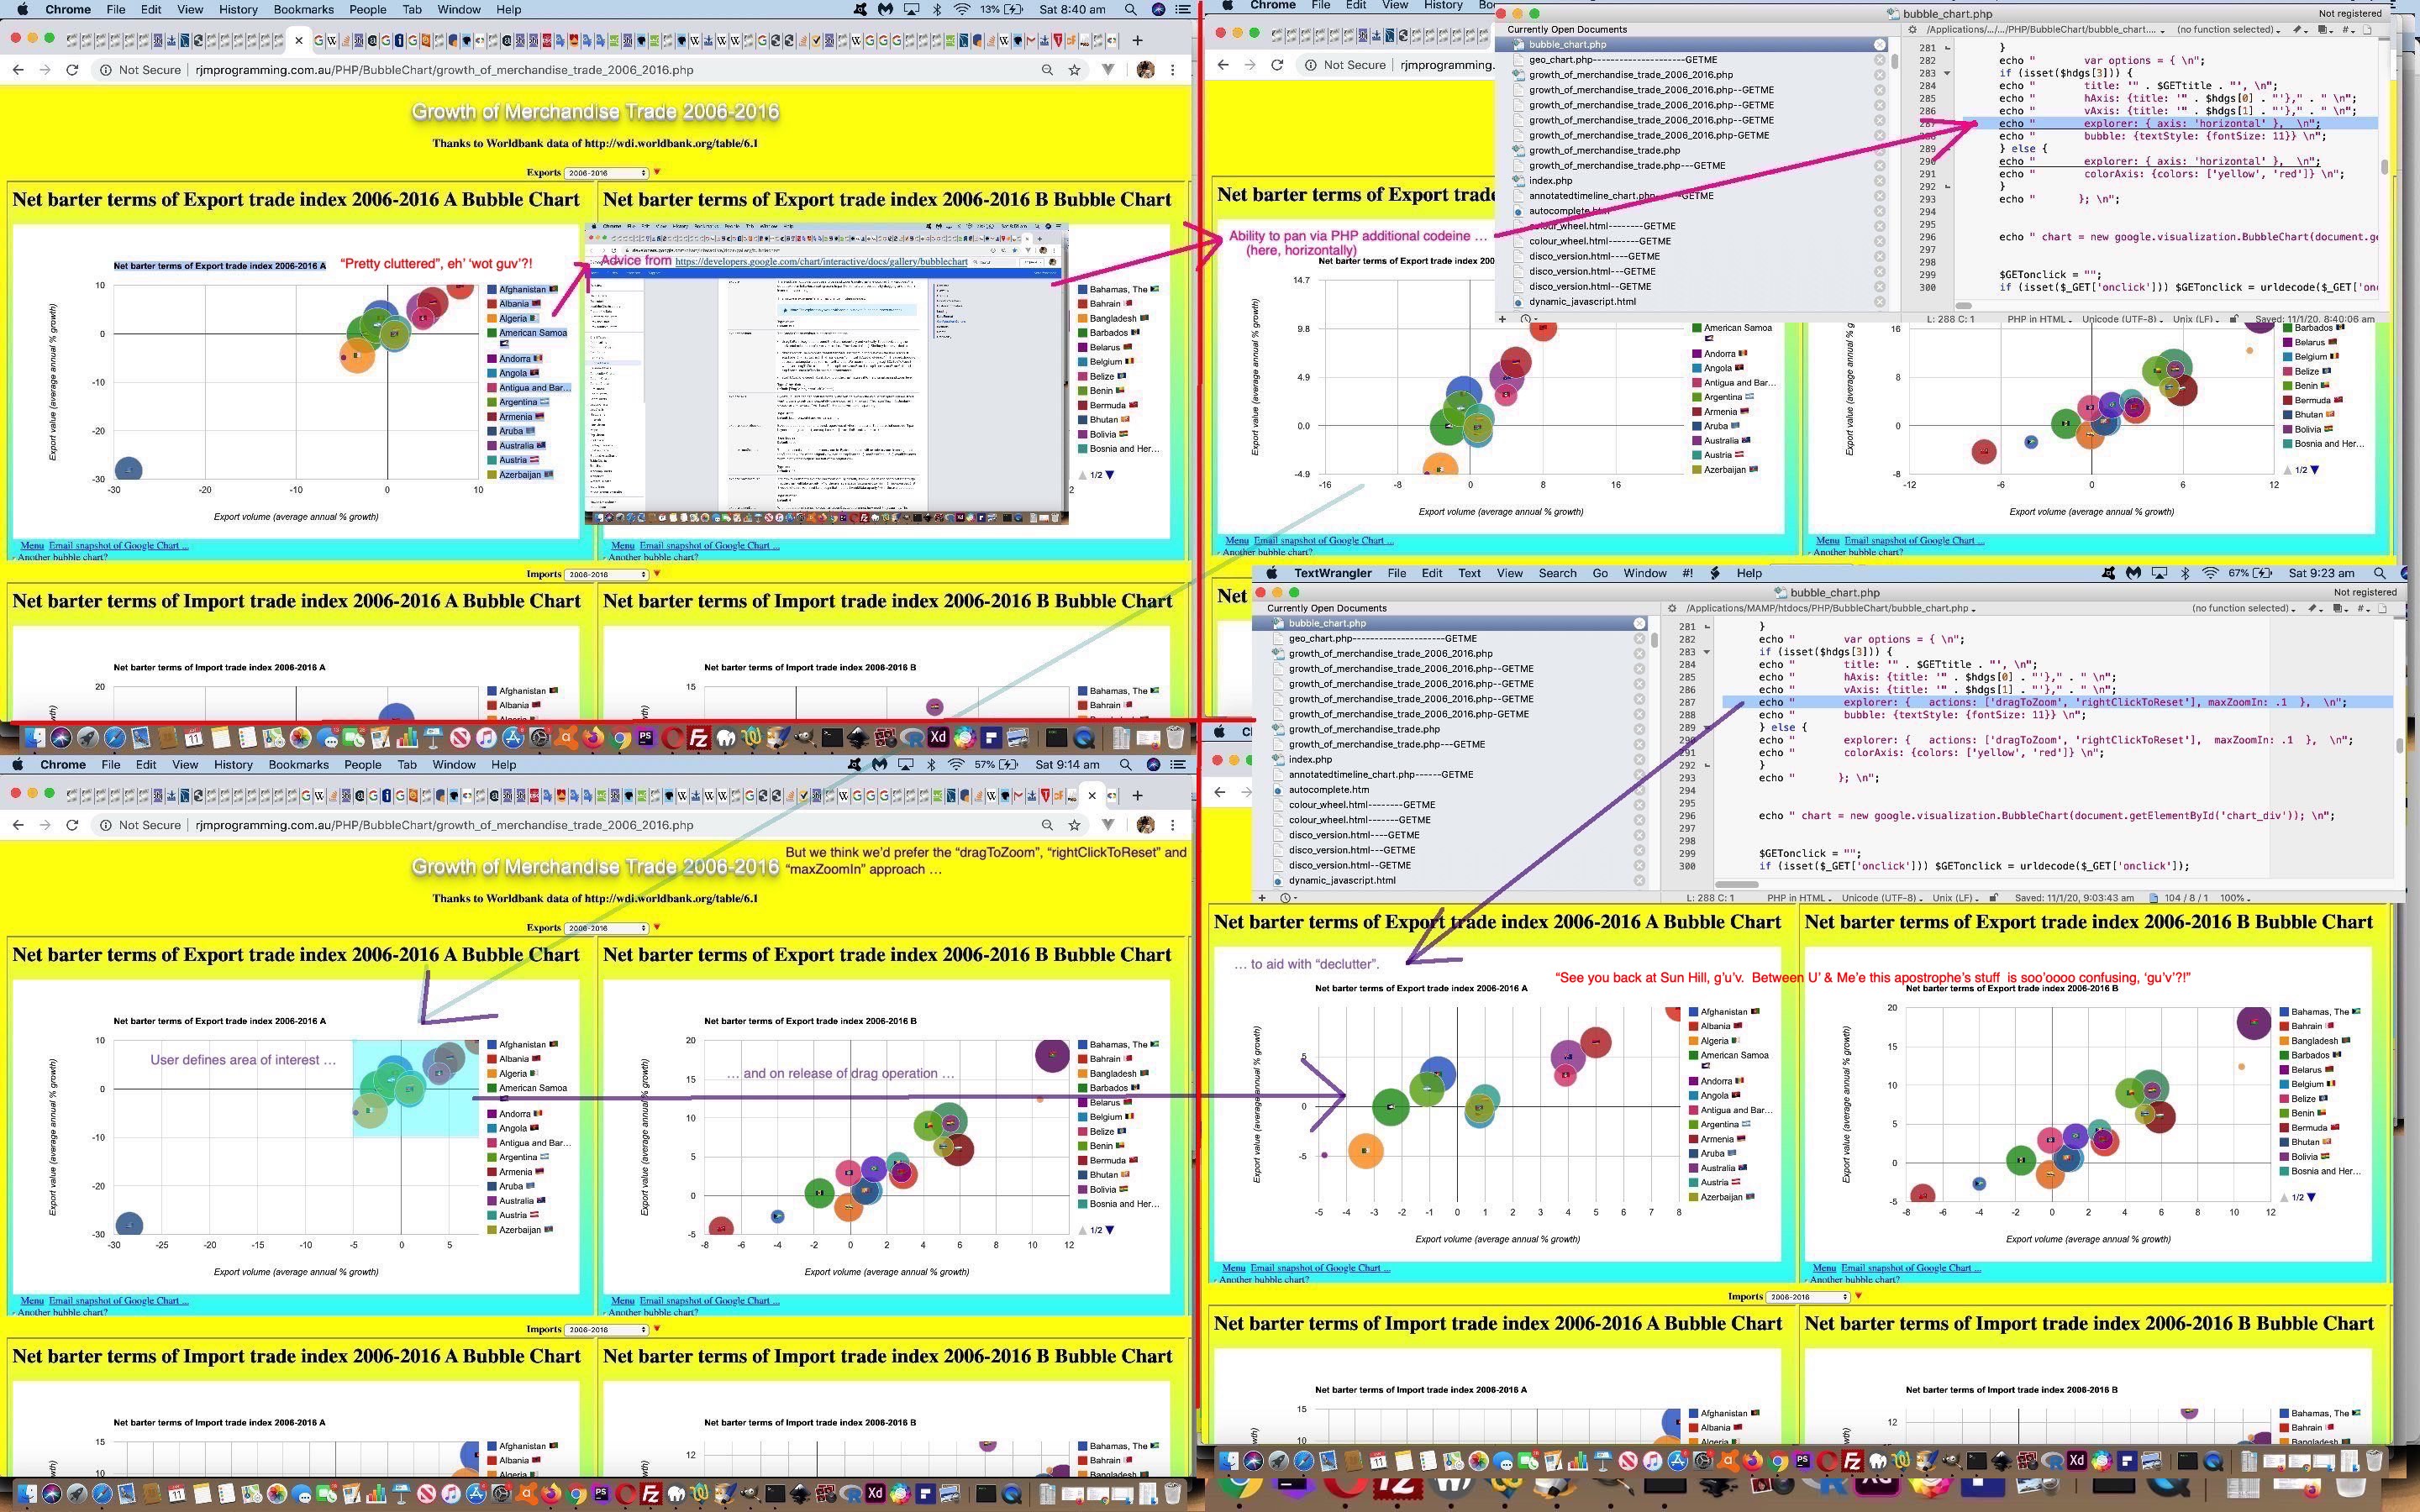
dragToZoom: The explorer’s default behavior is to zoom in and out when the user scrolls. If explorer: { actions: [‘dragToZoom’, ‘rightClickToReset’] } is used, dragging across a rectangular area zooms into that area. We recommend using rightClickToReset whenever dragToZoom is used. See explorer.maxZoomIn, explorer.maxZoomOut, and explorer.zoomDelta for zoom customizations.
rightClickToReset: Right clicking on the chart returns it to the original pan and zoom level.
Sounds promising! But not, we suspected, and it PanNed (tee hee) out(lier) to be true (boo hoo), with mobile platforms (not into drag), alas. Nevertheless, on non-mobile, we tried the “dragToPan” default idea initially, helping our mind “center things” but not great for “decluttering” purposes. But the “dragToZoom” (coupled with “rightClickToReset” idea) was a great tool for Bubble Chart decluttering as you can see with today’s tutorial picture. And so, we implemented it for the changed growth_of_merchandise_trade_2006_2016.php you can click/touch this live run link supervising a $_GET[‘options’] (or $_POST[‘options]) driven, changed bubble_chart.php Google Chart Bubble Chart interfacer.
.
Previous relevant PHP Worldbank Growth of Merchandise Trade Emoji Flags Tutorial is shown below.
With Internationalization thoughts fresh in the mind, we decided to revisit PHP Worldbank Growth of Merchandise Trade Tutorial‘s Country by Country “Growth of Merchandise Trade” Bubble Chart to see what we now know more about to improve this web application.
And so we wondered whether we could enhance with Emoji Flags. Sounds reasonable, but when we’ve done this in the recent past (eg. Window LocalStorage Client Versus Server Map Tutorial) it’s been with Javascript clientside logic, not PHP serverside code, as is the go with our Google Chart Bubble Chart interfacing. Well, here’s our approach (making global $flagentity variable filled in with Emoji Flag content as found) here …
<?php
$flagentity="";  // global here and two below

$lri=["A","B","C","D","E","F","G","H","I","J","K","L","M","N","O","P","Q","R","S","T","U","V","W","X","Y","Z"];

$dri=["U+1F1E6","U+1F1E7","U+1F1E8","U+1F1E9","U+1F1EA","U+1F1EB","U+1F1EC","U+1F1ED","U+1F1EE","U+1F1EF","U+1F1F0","U+1F1F1","U+1F1F2","U+1F1F3","U+1F1F4","U+1F1F5","U+1F1F6","U+1F1F7","U+1F1F8","U+1F1F9","U+1F1FA","U+1F1FB","U+1F1FC","U+1F1FD","U+1F1FE","U+1F1FF"];

$iso_country_codes=['AF','Afghanistan',

'AX','Aland Islands',

'AL','Albania',

'DZ','Algeria',

'AS','American Samoa',

'AD','Andorra', ... ];  // global ... not all shown


function uvaltosfcp($string) { // thanks to https://stackoverflow.com/questions/1805802/php-convert-unicode-codepoint-to-utf-8

  return html_entity_decode(preg_replace("/U\+([0-9A-F]{5})/", "&#x\\1;", $string), ENT_NOQUOTES, 'UTF-8');

}


function flagflag($inctryname) {

  global $flagentity, $iso_country_codes, $lri, $dri;

  $uretv="";

  $flagentity="";

  if ($inctryname != "") {

  $matchfound=false;

  for ($im=1; $im<sizeof($iso_country_codes); $im+=2) {

    if (strpos(strtolower($iso_country_codes[$im]), strtolower($inctryname)) !== false) {

      for ($jm=0; $jm<sizeof($lri); $jm++) {

       if (strtoupper(substr($iso_country_codes[-1 + $im],0,1)) == $lri[$jm]) {

         $uretv.=$dri[$jm]; //uvaltosfcp($dri[$jm]);

         $matchfound=true;

       }

      }

      for ($jm=0; $jm<sizeof($lri); $jm++) {

       if (strtoupper(substr($iso_country_codes[-1 + $im],1,1)) == $lri[$jm]) {

         $uretv.=$dri[$jm]; //uvaltosfcp($dri[$jm]);

       }

      }

      $flagentity=uvaltosfcp($uretv); //$uretv;

      return $inctryname;

    }

  }

  if ($uretv == "" && !$matchfound) {

  for ($im=1; $im<sizeof($iso_country_codes); $im+=2) {

    if (strpos(explode(",",strtolower($iso_country_codes[$im]))[0], explode(",",strtolower($inctryname))[0]) !== false) {

      for ($jm=0; $jm<sizeof($lri); $jm++) {

       if (strtoupper(substr($iso_country_codes[-1 + $im],0,1)) == $lri[$jm]) {

         $uretv.=$dri[$jm]; //uvaltosfcp($dri[$jm]);

         $matchfound=true;

       }

      }

      for ($jm=0; $jm<sizeof($lri); $jm++) {

       if (strtoupper(substr($iso_country_codes[-1 + $im],1,1)) == $lri[$jm]) {

         $uretv.=$dri[$jm]; //uvaltosfcp($dri[$jm]);

       }

      }

      $flagentity=uvaltosfcp($uretv); //$uretv;

      return $inctryname;

    }

  }

  }

  }

  return $inctryname;

}
?>
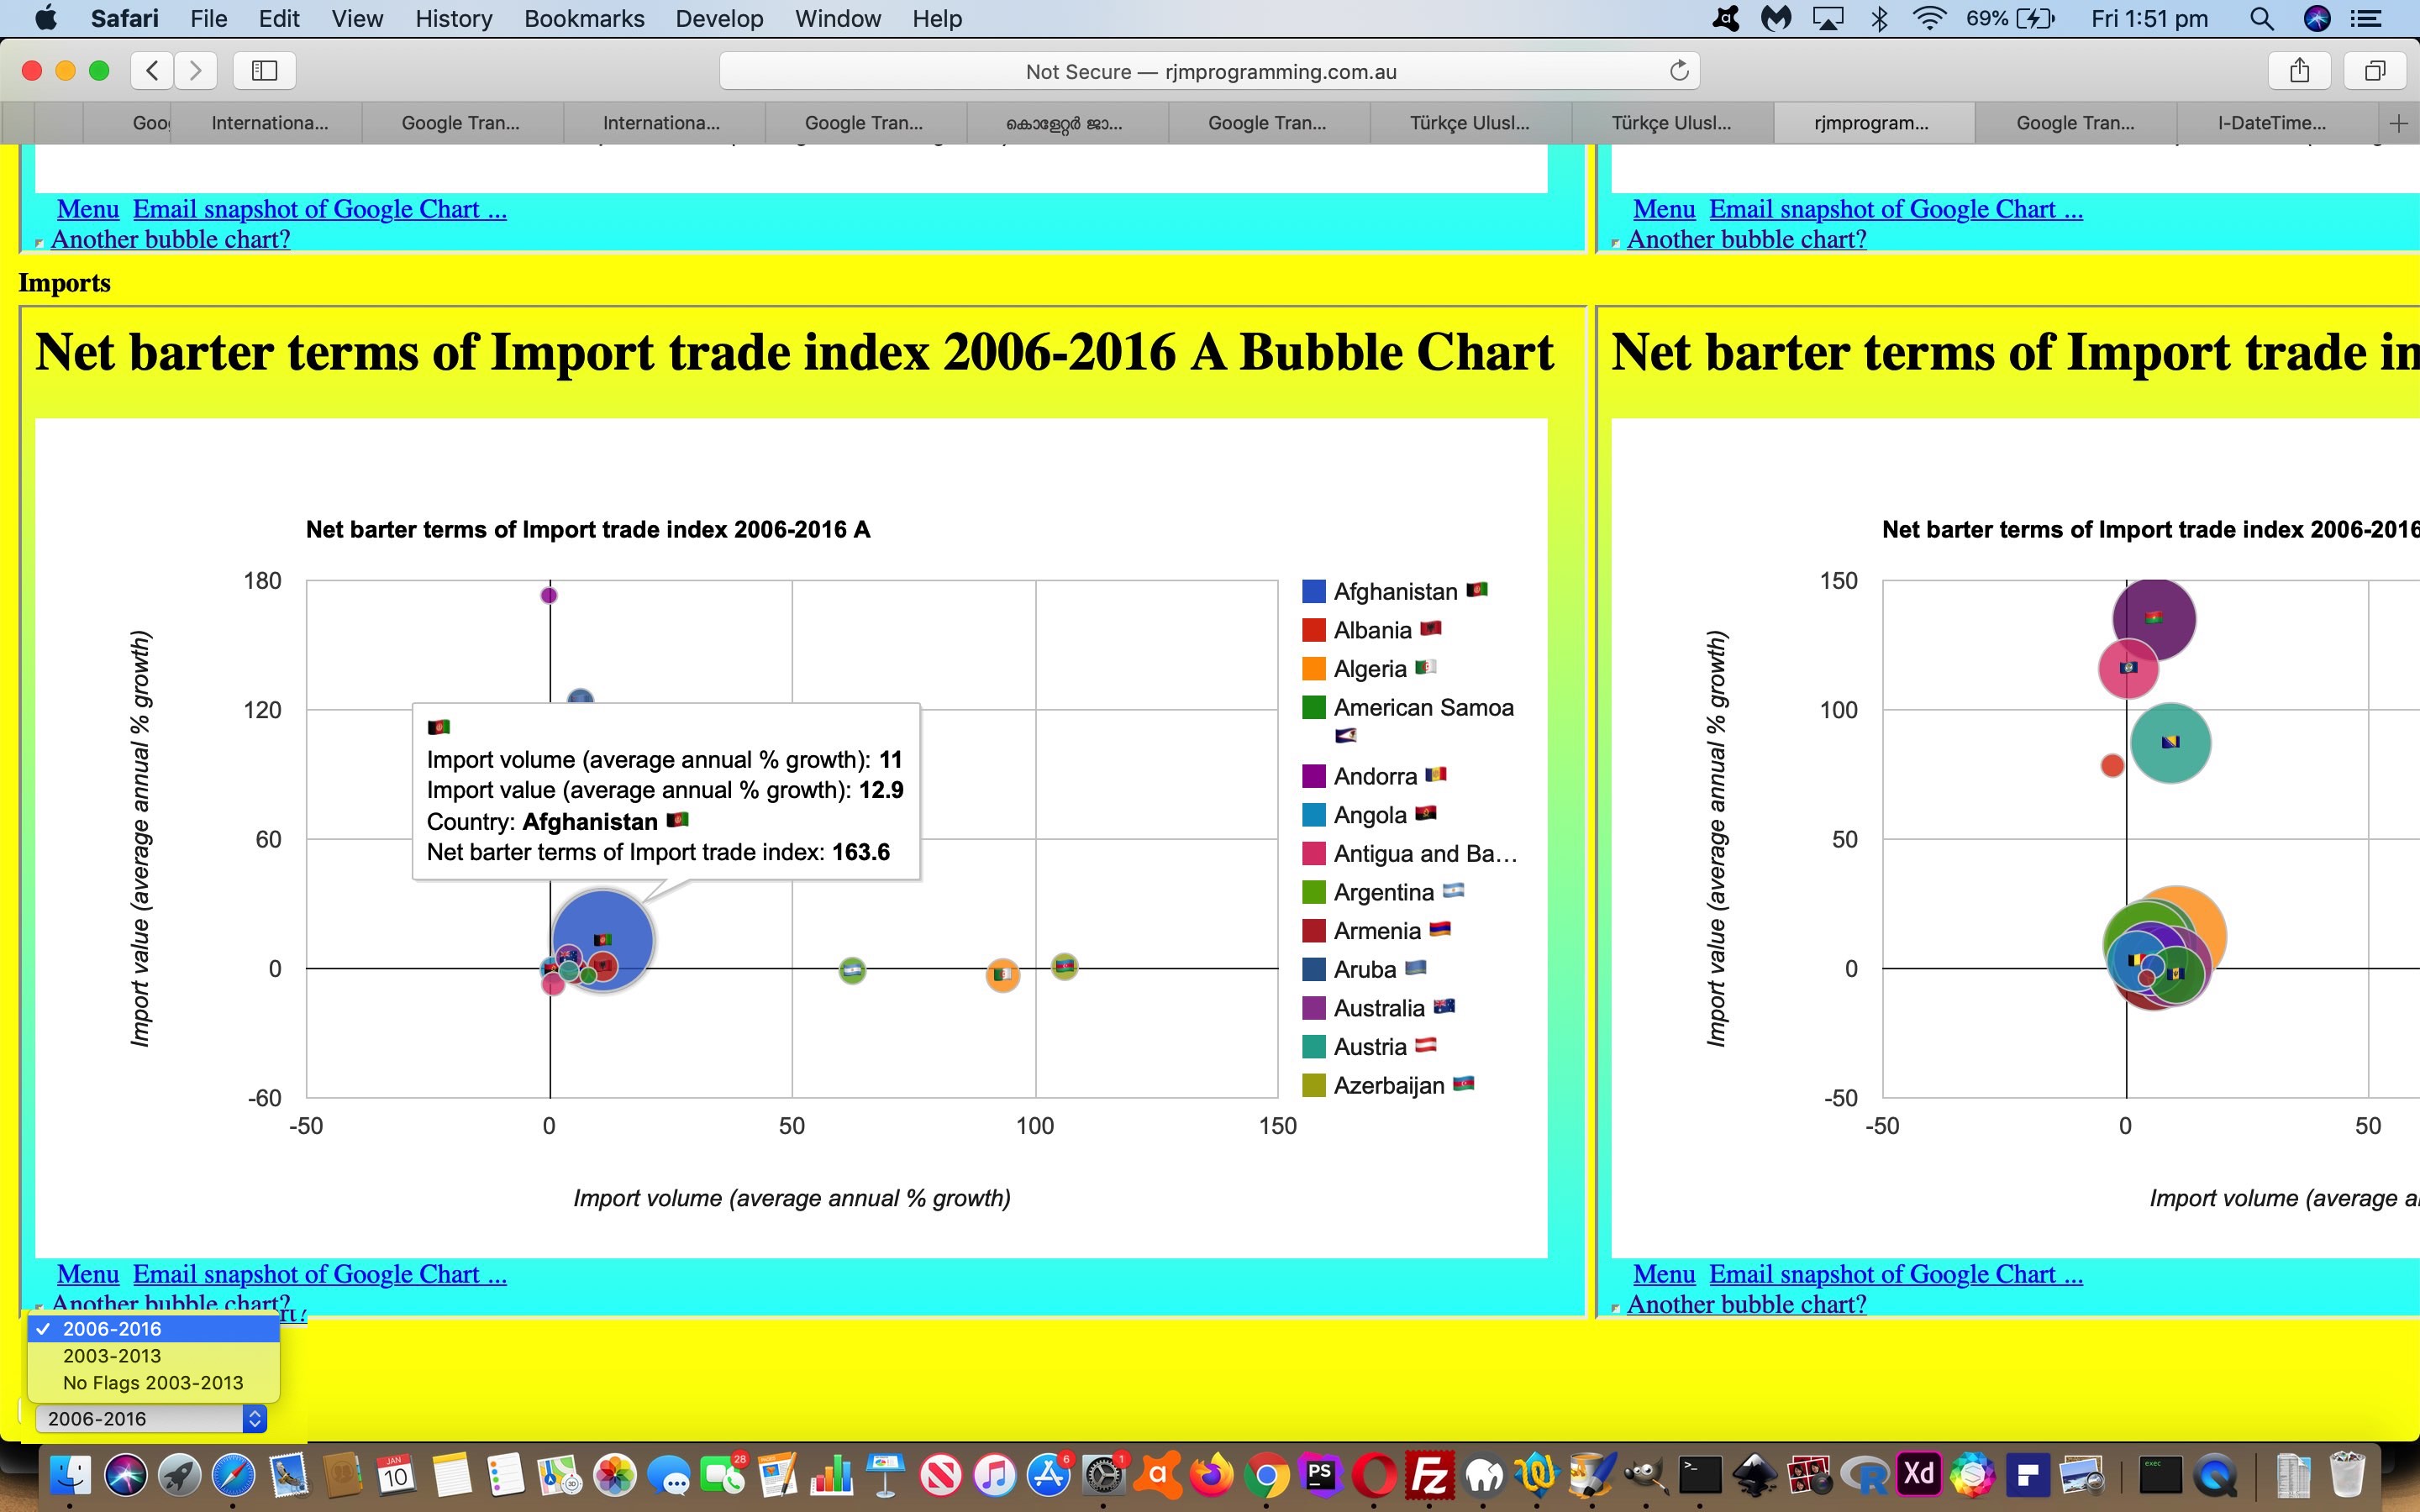
Another “peer integration” issue today too. The resource we’d like to thank regarding today’s work, that being Growth of Merchandise Trade has updated its data set for the year range 2006-2016 and we’d like to maintain this, and the previous 2003-2013 data set, for comparison purposes. The Bubble Chart report is the important thing though, and so a select (dropdown) element, probably “below the fold” for you, facilitates this expansion of functionality.
To try the “how we got there” growth_of_merchandise_trade_2006_2016.php you can click/touch this live run link.
Previous relevant PHP Worldbank Growth of Merchandise Trade Tutorial is shown below.
We’ve said it before, and (no doubt) we’ll say it again … there are great public data sources out there for you to explore.
As far as international data goes the Worldbank series of statistics is great, so, thanks.
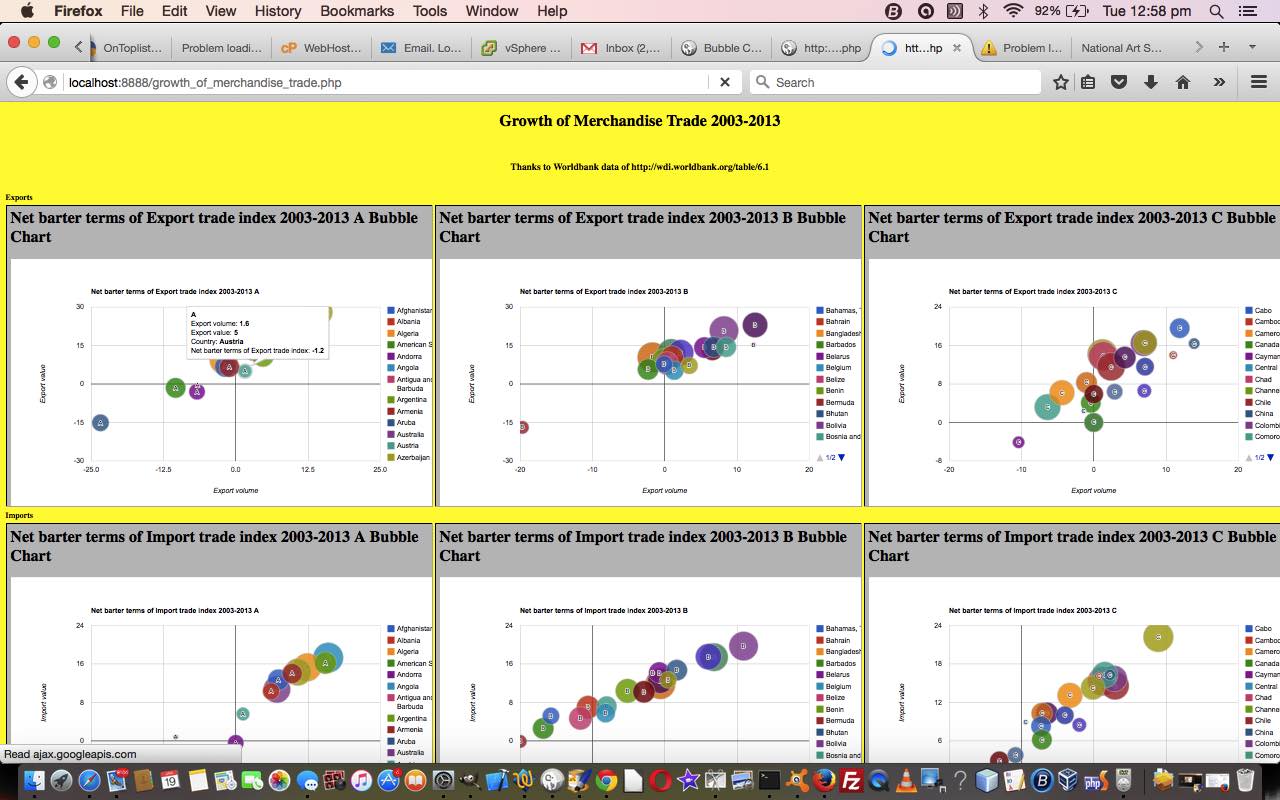
Today we combine the Worldbank data for Growth of Merchandise Trade 2003-2013 with the wonderful Google Chart Bubble Chart to create (52 = (first letters of country name) 26 x 2 (concepts: Exports and Imports)) reporting charts of interest, we hope. Again, as with any reporting subject, it is a personal thing, whether the subject matter of a report is of interest, but you could say that about so many things in life.
So, we offer some PHP source code you could call growth_of_merchandise_trade.php and a live run link as well, the full loading of which requires patience.
Stop Press
Tomorrow we go over what was needed to change PHP code above to be more mobile friendly …
- growth_of_merchandise_trade.php changes (to cater for select event (mobile touch) functionality) and live run link for yesterday’s web application
If this was interesting you may be interested in this too.
If this was interesting you may be interested in this too.
If this was interesting you may be interested in this too.


