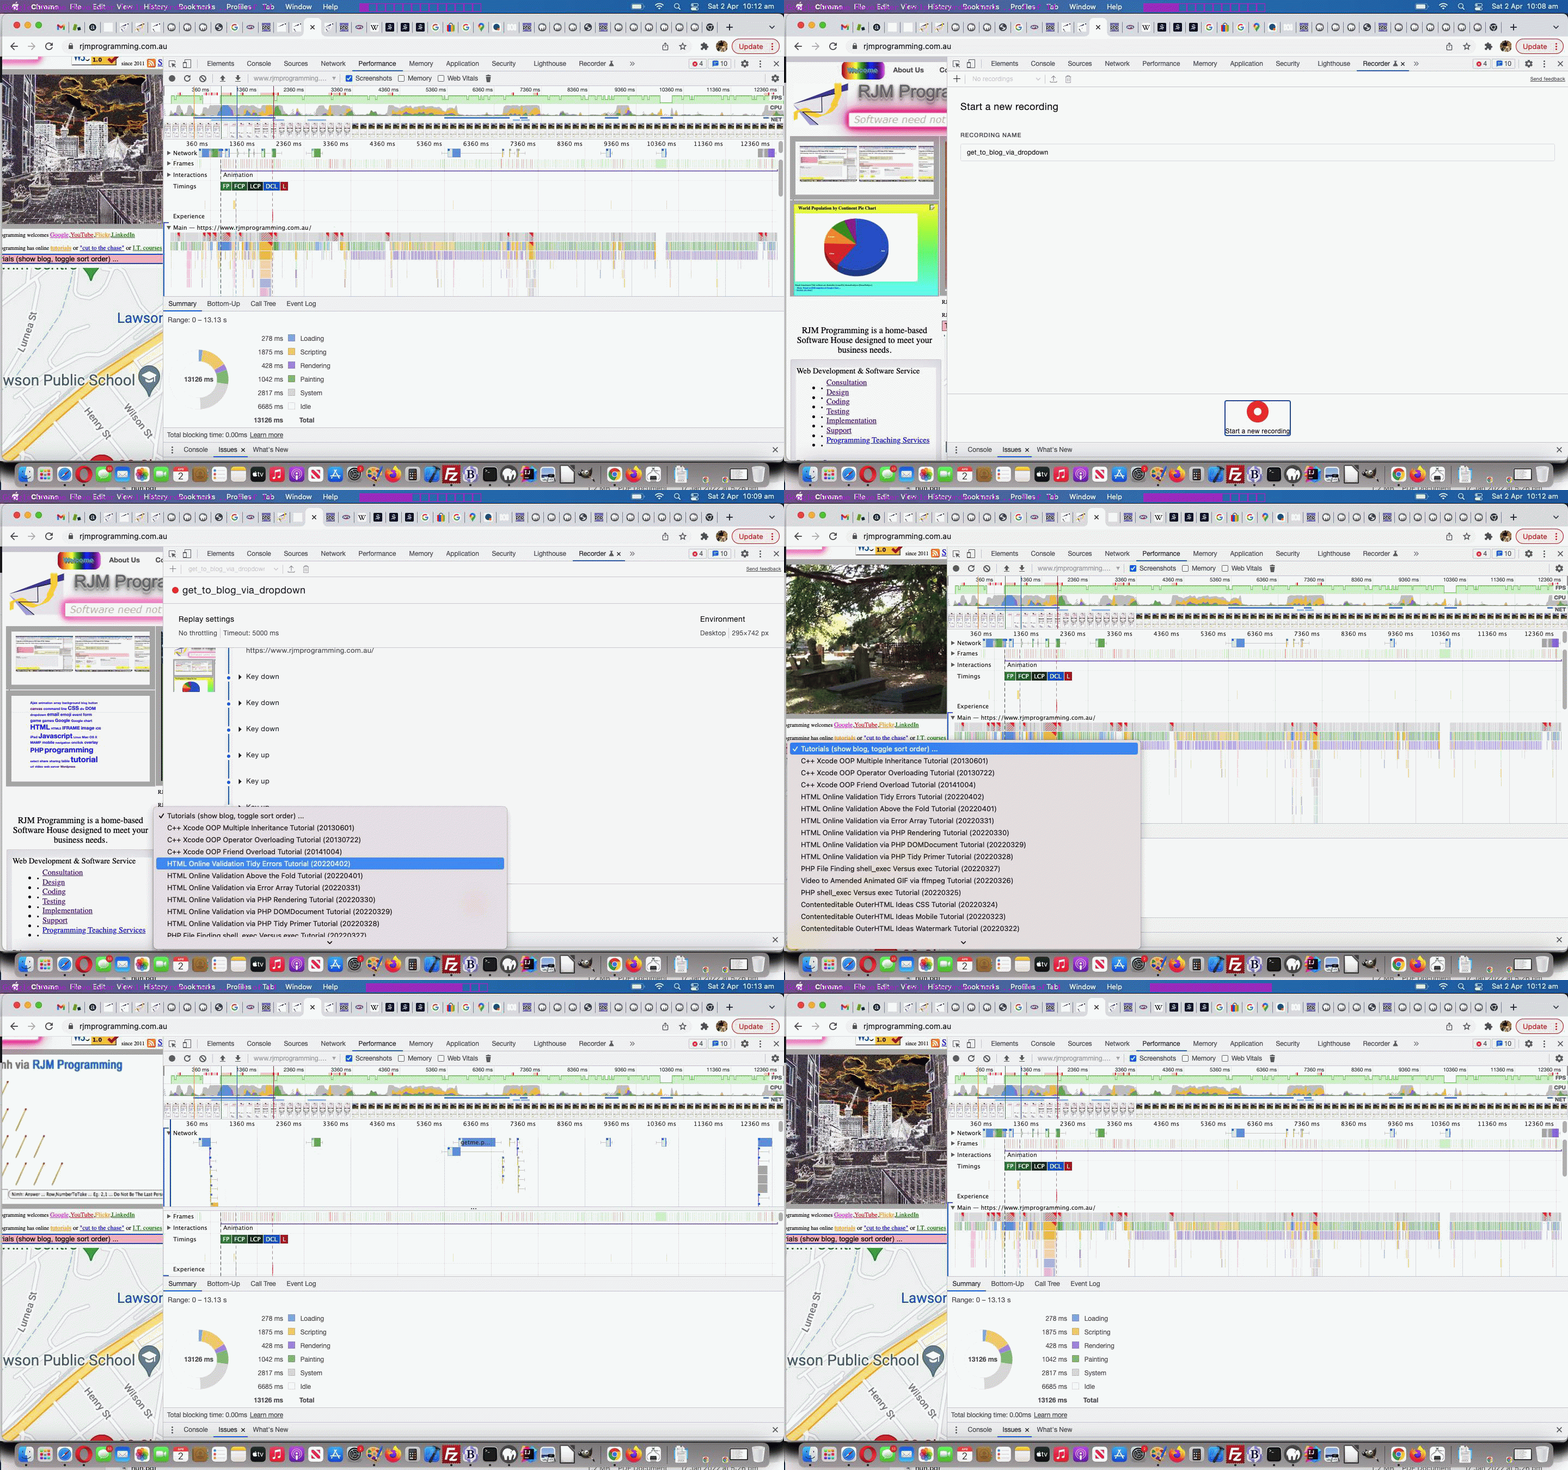
When programming an online procedure it can be a consideration as to how long the procedure will take. As such, you may want to have a scientific approach to assessing a procedure that takes the form of a web browser initiated set of web page(s). Well, we came upon (the use of) …
- Google Chrome web browser …
- View -> Developer -> Developer Tools
- Recorder (tab (tool))
… as that “Performance Measuring Tool” separating the performance indicators into …
- Loading
- Scripting
- Rendering
- Painting
- System
- Idle
… and offering a Save and Replay functionality in order (for an “involved” programmer) to change and monitor those changes (to the procedure) in a (scientifically based) performance context. Interesting, huh?!
If this was interesting you may be interested in this too.


