
Python Matplotlib Pie Chart PHP Crontab Tutorial
Onto yesterday’s Python Matplotlib Pie Chart Primer Tutorial‘s work …
- further to local Apache/PHP web server, like MAMP, PHP understanding and supervising a Python Matplotlib module based Pie Chart web application … today …
- extending that PHP meets Python theme on the public RJM Programming we involve …
- updated PHP … to suit the use of …
- crontab …
ksh -c 'for i in `find /home/rjmprogr/public_html/Python -name "piechartpython_*.py"`; do /usr/bin/python3 $i ${i##*/} /home/rjmprogr/public_html/Python/ ; done'

ksh -c 'for i in `find /home/rjmprogr/public_html/Python -name "piechartpython_*.py"`; do rm -f "$i"; done'

ksh -c 'for i in `find /home/rjmprogr/public_html/Python -name "plot_*.png" -mmin +122`; do rm -f "$i"; done'

ksh -c 'for i in `find /home/rjmprogr/public_html/Python -name "output_image_*.png" -mmin +122`; do rm -f "$i"; done'
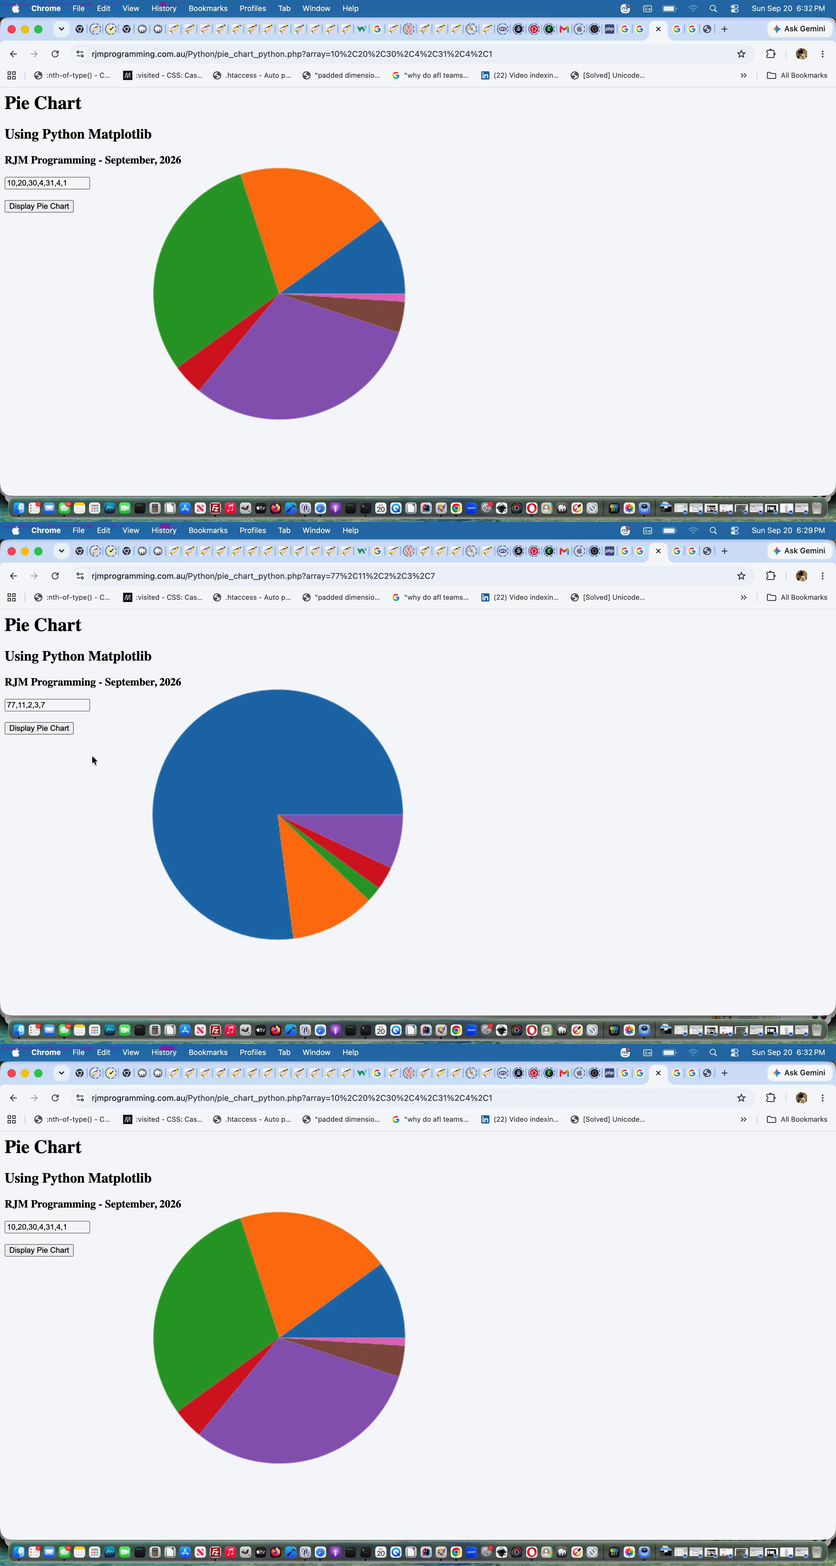
… means to run Python code where new arguments add image file folder and IP address personalization parts so that users do not stumble on other user Pie Chart specifications
… all still dealing with a minimalist Pie Chart we’ll add complexity to into the future with …
- the changed pie_chart_python.py Python … called via HTML form of …
- the changed pie_chart_python.php PHP Pie Chart (now public) web application you can also try below
Previous relevant Python Matplotlib Pie Chart Primer Tutorial is shown below.
Python Matplotlib Pie Chart Primer Tutorial
We’re off on a new discovery tour regarding …
- Python … as a programming language, and it’s module …
- Matplotlib
- command line Pie Chart application … Python pie_chart_python.py (superceeding this) …
# pie_chart_python.py

# September - 2026

# RJM Programming

# Thanks to https://www.w3schools.com/python/default.asp


import os

import matplotlib


# Set backend to Agg before importing pyplot

matplotlib.use('Agg')


import matplotlib.pyplot as plt

import matplotlib.image as mpimg


import numpy as np

#import plotly.express as px

from PIL import Image


nums = []

sofar = 0


if len(nums) <= 0:

  while sofar < 100:

     print(f"Enter your percentage value regarding a pie chart where so far {sofar} has already been allocated.")

     anum = input()

     nums.append(int(anum))

     sofar += int(anum)


y = np.array(nums)


fig, ax = plt.subplots()


ax.pie(y)


fig.savefig("plot.png")


# 1. Load the image

img = mpimg.imread('plot.png')


# 2. Process or manipulate the image (Optional)

# For example, let's look at the shape or apply changes

#print(f"Image shape: {img.shape}")


# 3. Create the plot without displaying it

plt.imshow(img)

plt.axis('off')  # Hide axis lines and labels


# 4. Save the result to a file instead of showing it

plt.savefig('output_image.png', bbox_inches='tight', pad_inches=0)

plt.close()


# Open the PNG image file

#with Image.open("plot.png") as img:

    # Display the image using your system's default viewer

    #img.show()


    # Optional: Load the data into memory so you can safely close the file

    #img.load()


exit()
… and … - working on our local Apache/PHP MAMP web server (only, so far, the reason being our public web server has no graphical $DISPLAY existant, and so the plt.show() Python codeline cannot be used, so we need to think more on integrations there) … PHP pie_chart_python.php …
<?php

// pie_chart_python.php

// RJM Programming - September, 2026

if (php_sapi_name() === 'cli') {

$command = '/usr/local/bin/python3 ' . dirname(__FILE__) . DIRECTORY_SEPARATOR . 'piechartpython.py'; // Your command

if (1 == 1) {

exec($command);

} else {

// Open the process pointer for reading

$handle = popen($command, 'r');


if ($handle) {

    // Read and output the buffer until the end of the file

    while (!feof($handle)) {

        echo fread($handle, 2048);

        flush(); // Send it to the browser immediately

    }

    pclose($handle);

}

}

exit;

} else if (strpos(str_replace('?','',$_SERVER['QUERY_STRING']), '&') === false) {

$waspy=file_get_contents(dirname(__FILE__) . DIRECTORY_SEPARATOR . 'pie_chart_python.py');

if (strpos($waspy, "nums = []") !== false) {

    if (isset($_GET['array'])) {

      file_put_contents(dirname(__FILE__) . DIRECTORY_SEPARATOR . 'piechartpython.py', str_replace("nums = []","nums = [" . str_replace('+',' ',urldecode($_GET['array'])) . "]",$waspy));

    }

}

//exec('php ' . dirname(__FILE__) . DIRECTORY_SEPARATOR . 'pie_chart_python.php > /dev/null 2> /dev/null');

exec('cd ' . dirname(__FILE__) . DIRECTORY_SEPARATOR . ' ; /Applications/MAMP/bin/php/php7.4.33/bin/php -n ./pie_chart_python.php > /dev/null 2> /dev/null ; open ./plot.png');

sleep(3);

}

echo "<html><body style=\"background:url(./plot.png);background-repeat:no-repeat;background-size:contain;\"></body></html>";

?>
… starting down this road with a simple …
… allowing a web browser address bar URL such as …
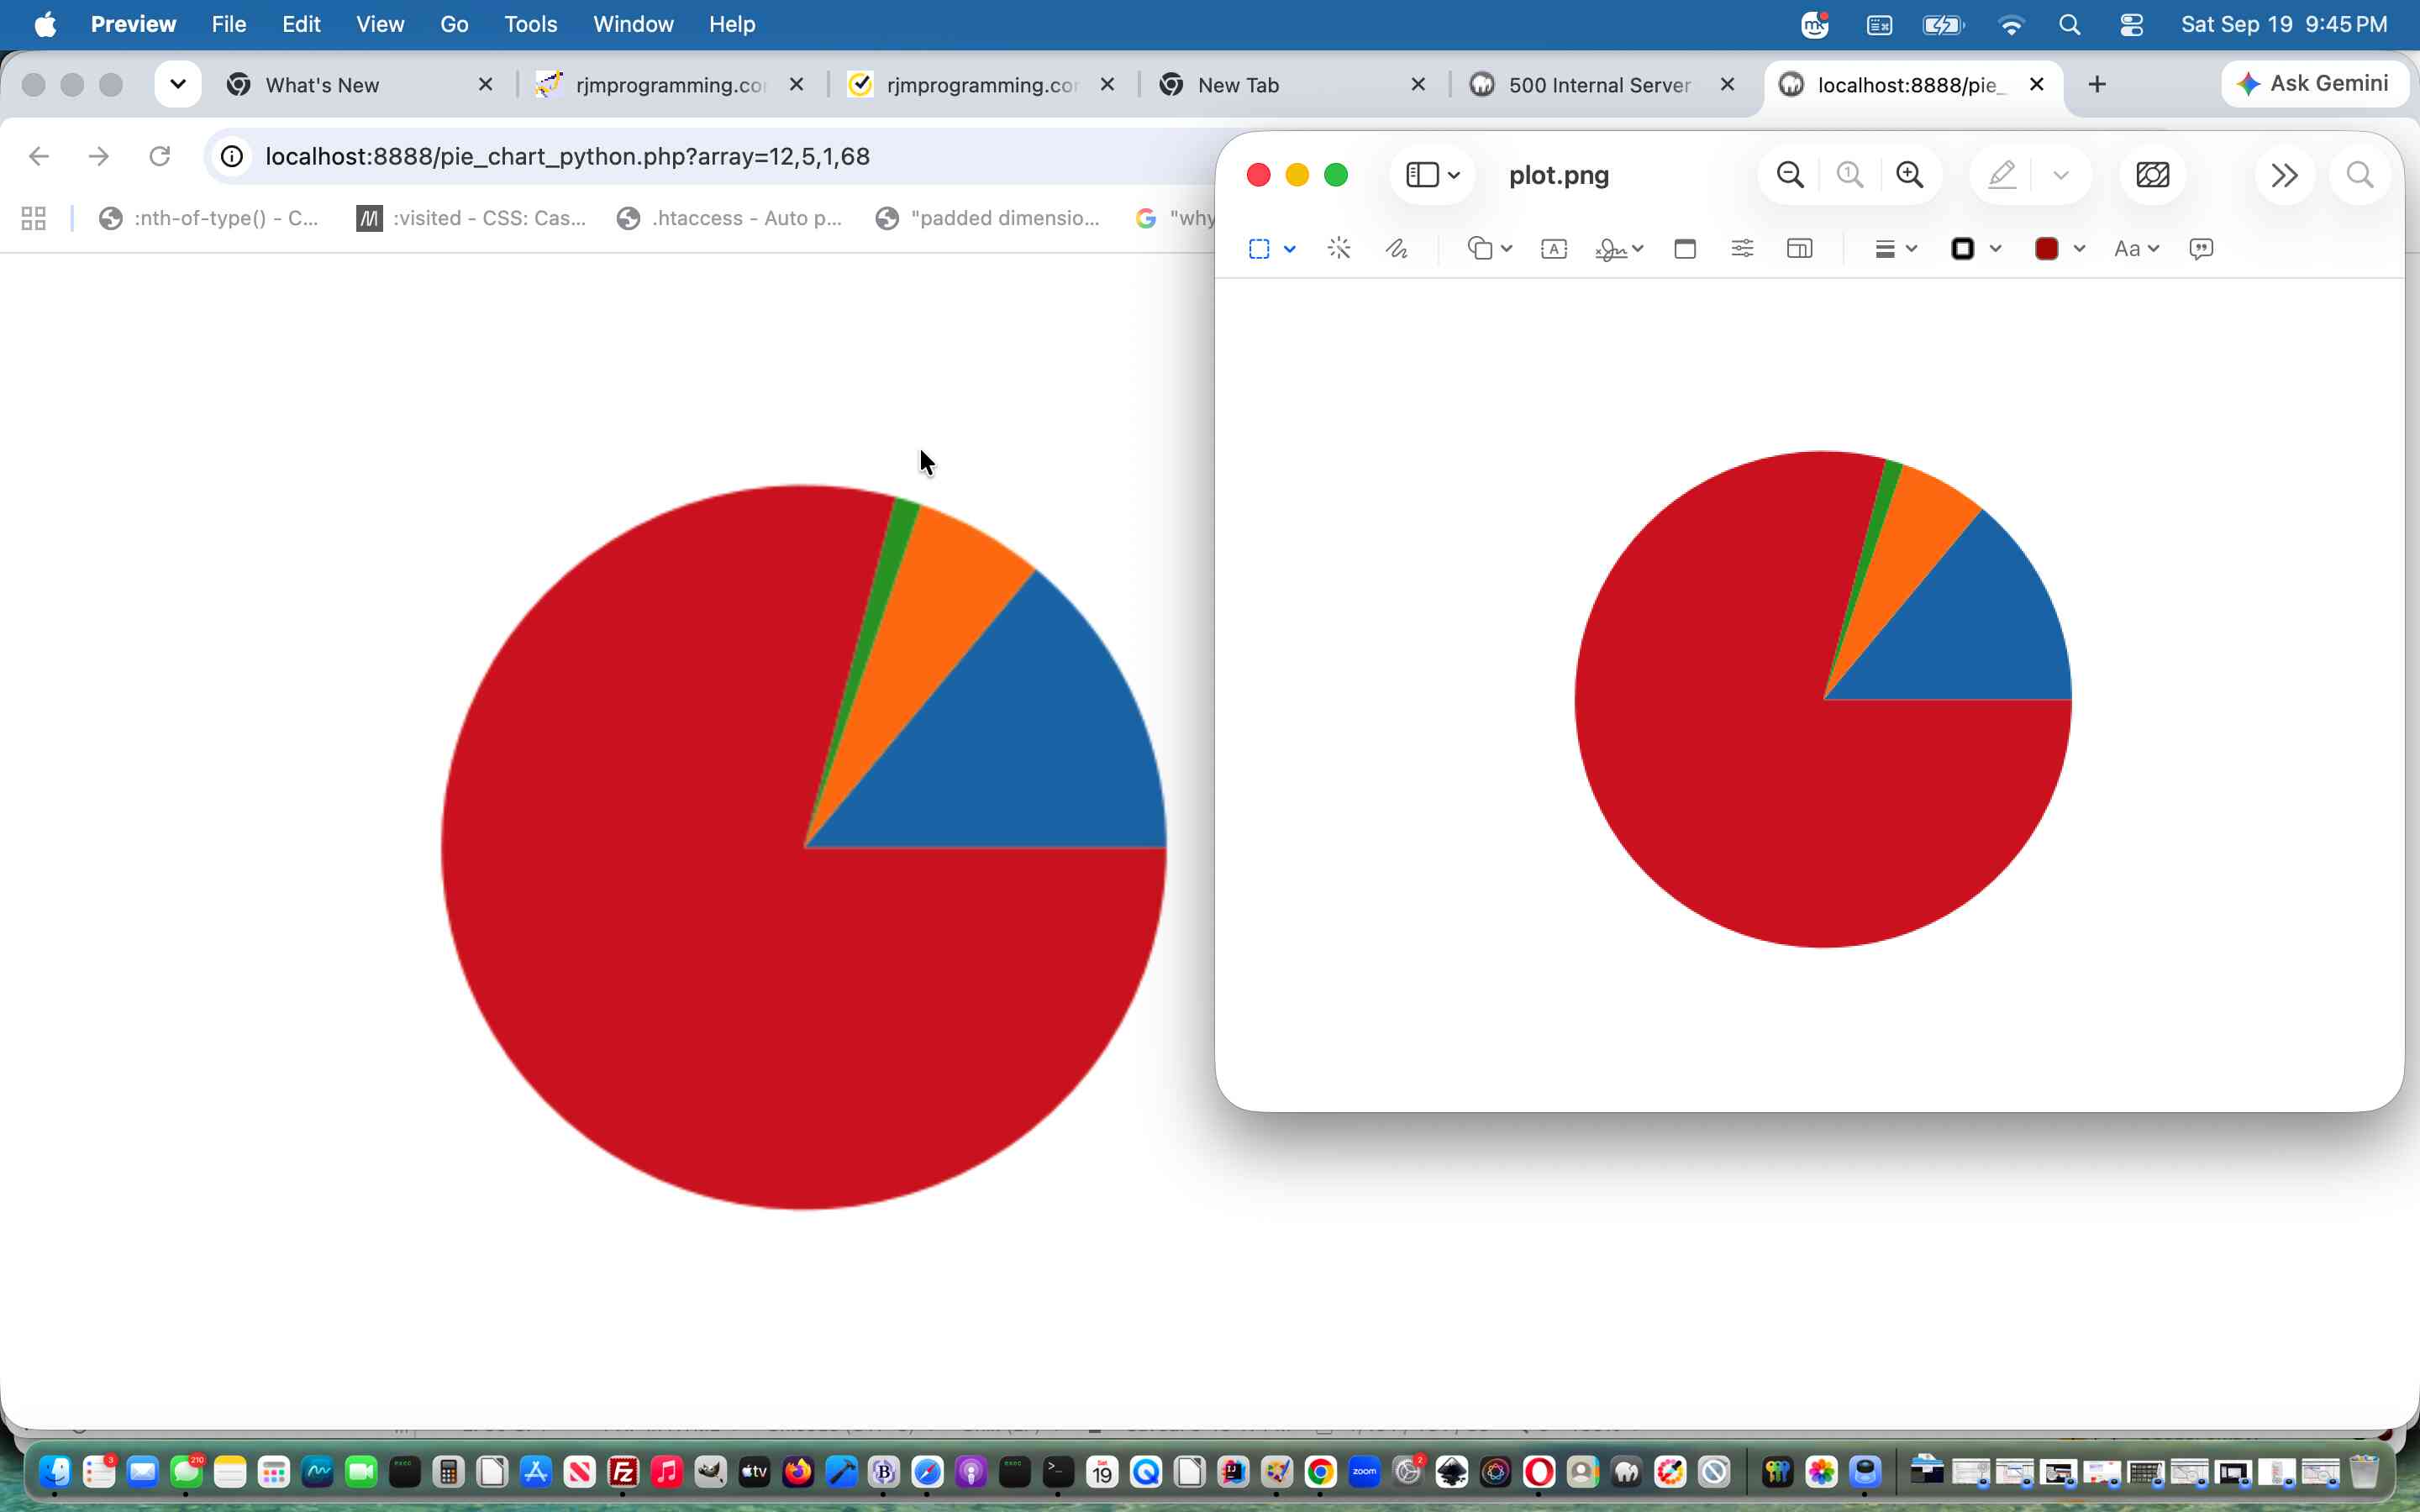
http://localhost:8888/pie_chart_python.php?array=12,5,1,68
… working for us, here, locally, displaying a Pie Chart …
… via our local Python3 Matplotlib modularized environment.
Did you know?
Your installer for Python modules is likely to be one of, for the example of matplotlib module …
pip install matplotlib
… or …
pip3 install matplotlib
… corresponding to whether command line …
python pie_chart_python.py
… or …
python3 pie_chart_python.py
… works for you at your local system command line.
If this was interesting you may be interested in this too.
If this was interesting you may be interested in this too.

