
Python Matplotlib Pie Chart Primer Tutorial
We’re off on a new discovery tour regarding …
- Python … as a programming language, and it’s module …
- Matplotlib
- command line Pie Chart application … Python pie_chart_python.py (superceeding this) …
# pie_chart_python.py

# September - 2026

# RJM Programming

# Thanks to https://www.w3schools.com/python/default.asp


import os

import matplotlib


# Set backend to Agg before importing pyplot

matplotlib.use('Agg')


import matplotlib.pyplot as plt

import matplotlib.image as mpimg


import numpy as np

#import plotly.express as px

from PIL import Image


nums = []

sofar = 0


if len(nums) <= 0:

  while sofar < 100:

     print(f"Enter your percentage value regarding a pie chart where so far {sofar} has already been allocated.")

     anum = input()

     nums.append(int(anum))

     sofar += int(anum)


y = np.array(nums)


fig, ax = plt.subplots()


ax.pie(y)


fig.savefig("plot.png")


# 1. Load the image

img = mpimg.imread('plot.png')


# 2. Process or manipulate the image (Optional)

# For example, let's look at the shape or apply changes

#print(f"Image shape: {img.shape}")


# 3. Create the plot without displaying it

plt.imshow(img)

plt.axis('off')  # Hide axis lines and labels


# 4. Save the result to a file instead of showing it

plt.savefig('output_image.png', bbox_inches='tight', pad_inches=0)

plt.close()


# Open the PNG image file

#with Image.open("plot.png") as img:

    # Display the image using your system's default viewer

    #img.show()


    # Optional: Load the data into memory so you can safely close the file

    #img.load()


exit()
… and … - working on our local Apache/PHP MAMP web server (only, so far, the reason being our public web server has no graphical $DISPLAY existant, and so the plt.show() Python codeline cannot be used, so we need to think more on integrations there) … PHP pie_chart_python.php …
<?php

// pie_chart_python.php

// RJM Programming - September, 2026

if (php_sapi_name() === 'cli') {

$command = '/usr/local/bin/python3 ' . dirname(__FILE__) . DIRECTORY_SEPARATOR . 'piechartpython.py'; // Your command

if (1 == 1) {

exec($command);

} else {

// Open the process pointer for reading

$handle = popen($command, 'r');


if ($handle) {

    // Read and output the buffer until the end of the file

    while (!feof($handle)) {

        echo fread($handle, 2048);

        flush(); // Send it to the browser immediately

    }

    pclose($handle);

}

}

exit;

} else if (strpos(str_replace('?','',$_SERVER['QUERY_STRING']), '&') === false) {

$waspy=file_get_contents(dirname(__FILE__) . DIRECTORY_SEPARATOR . 'pie_chart_python.py');

if (strpos($waspy, "nums = []") !== false) {

    if (isset($_GET['array'])) {

      file_put_contents(dirname(__FILE__) . DIRECTORY_SEPARATOR . 'piechartpython.py', str_replace("nums = []","nums = [" . str_replace('+',' ',urldecode($_GET['array'])) . "]",$waspy));

    }

}

//exec('php ' . dirname(__FILE__) . DIRECTORY_SEPARATOR . 'pie_chart_python.php > /dev/null 2> /dev/null');

exec('cd ' . dirname(__FILE__) . DIRECTORY_SEPARATOR . ' ; /Applications/MAMP/bin/php/php7.4.33/bin/php -n ./pie_chart_python.php > /dev/null 2> /dev/null ; open ./plot.png');

sleep(3);

}

echo "<html><body style=\"background:url(./plot.png);background-repeat:no-repeat;background-size:contain;\"></body></html>";

?>
… starting down this road with a simple …
… allowing a web browser address bar URL such as …
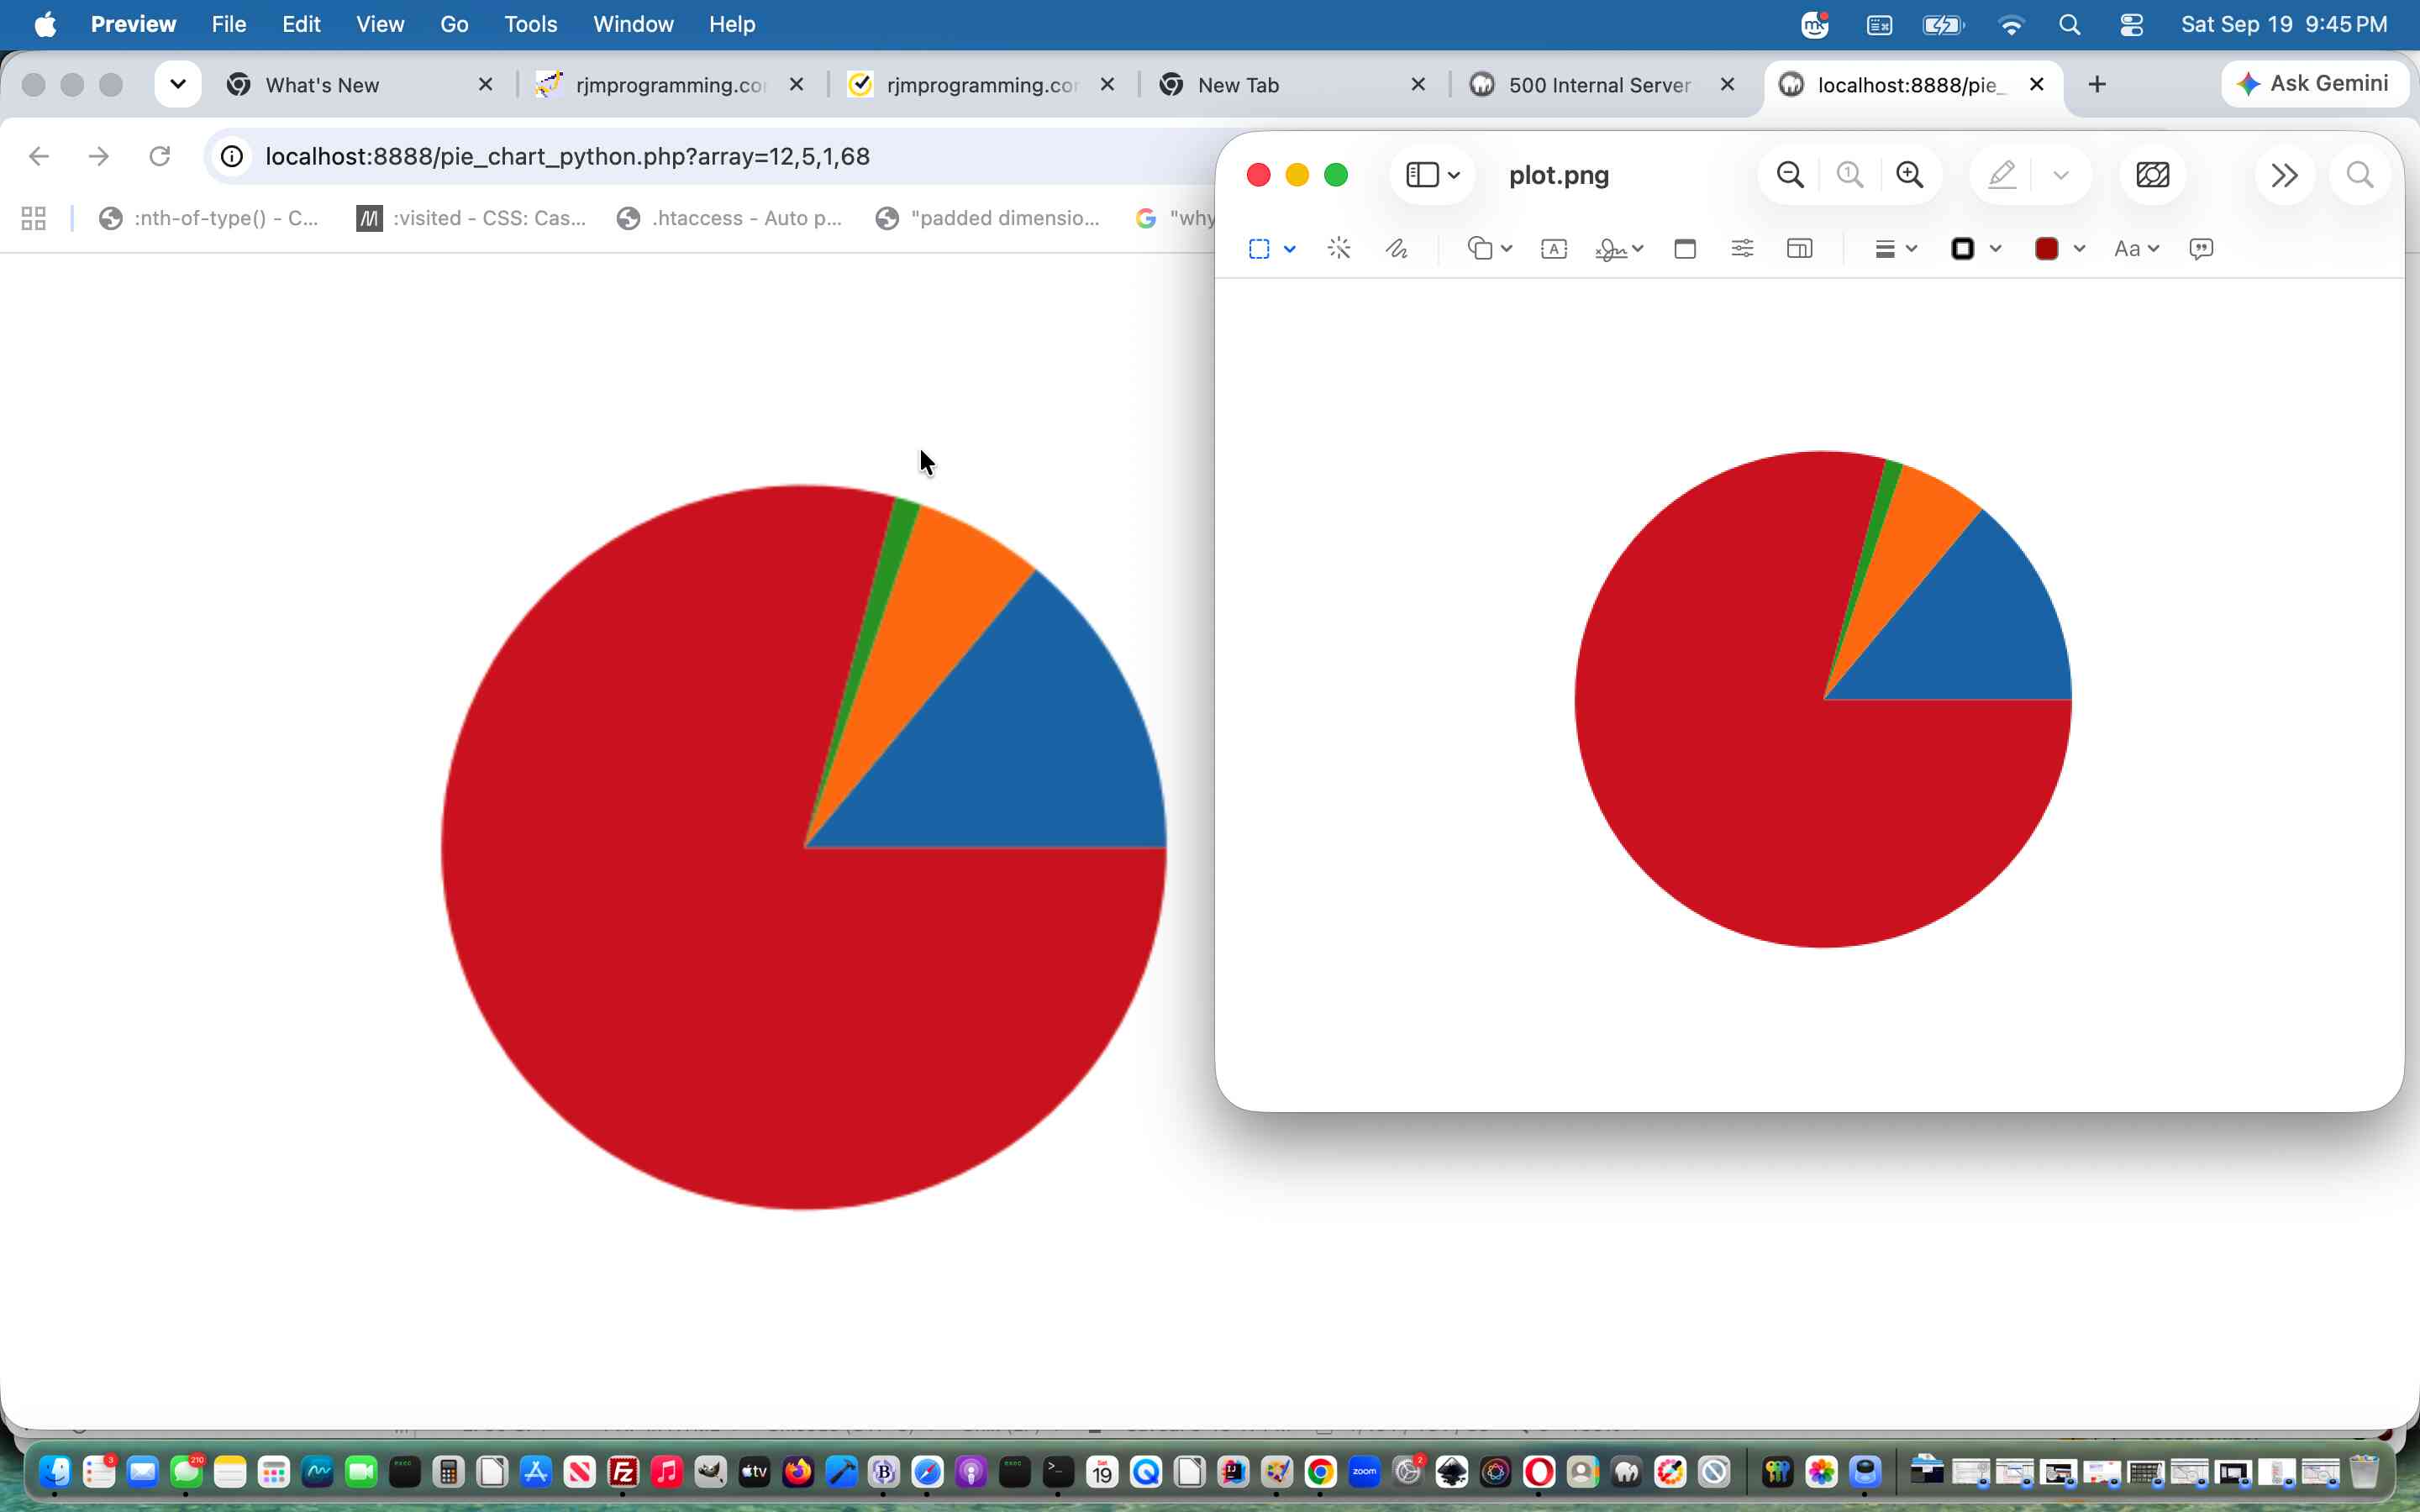
http://localhost:8888/pie_chart_python.php?array=12,5,1,68
… working for us, here, locally, displaying a Pie Chart …
… via our local Python3 Matplotlib modularized environment.
If this was interesting you may be interested in this too.

