
OpenOffice CSV Chart Primer Tutorial
Here is a tutorial that introduces you to a great suite of office automation programs called OpenOffice, by Apache Software Foundation. OpenOffice has functionality like the Microsoft Office suite of programs, bringing the user a lot of the feel of those well loved concepts to your document creation work, and integrated into the one place. Great, mates, huh?!
Apache OpenOffice (AOO) is an open-source office productivity software suite. It descends from OpenOffice.org and IBM Lotus Symphony.[5]
Apache OpenOffice contains a word processor (Writer), a spreadsheet (Calc), a presentation application (Impress), a drawing application (Draw), a formula editor (Math), and a database management application (Base).[6]
Apache OpenOffice’s default file format is the OpenDocument Format (ODF), an ISO/IEC standard, which originated with OpenOffice.org. It can also read a wide variety of other file formats, with particular attention to those from Microsoft Office.
Apache OpenOffice is developed for Linux, OS X and Windows, with ports to other operating systems. It is distributed under the Apache License.[4] The first release was version 3.4.0, on 8 May 2012.[1]
As you would imagine, such a project has many parts to it, and we will explore some over time, but, as always …
- Feel free to explore yourself
- Visit search engines with more specific queries about specific topics, always add “OpenOffice” in there somewhere, and arrive at specialized forums and/or blogs and/or official sites
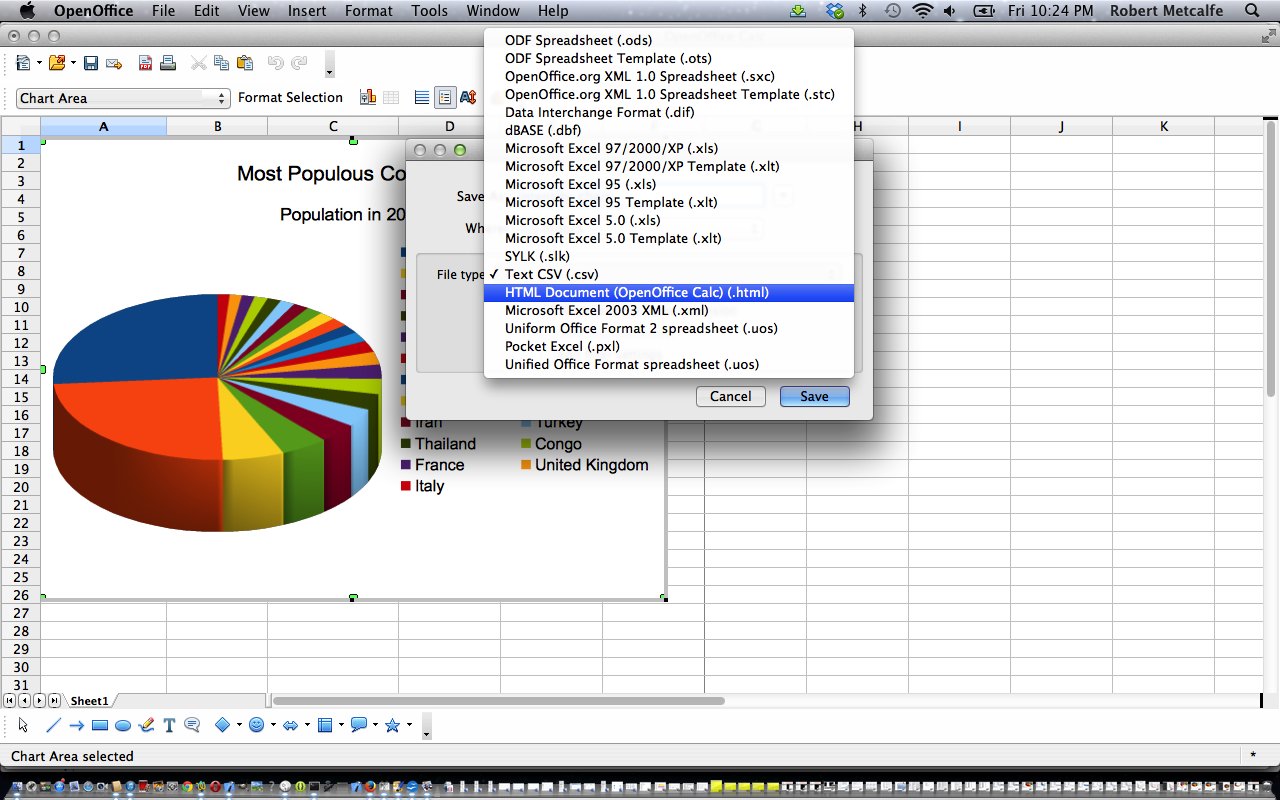
Today, we use some CSV data used previously at PHP/Javascript/HTML Google Chart JSON Data Table Import of CSV Tutorial to open a spreadsheet (like Microsoft Office Excel would do), and we will delimit, as required, and create a couple of charts (of interpretations of the data), which we will export to PDF and display on a local MAMP webserver (we are on a Mac laptop … we have shrunk to a bit of dust that you get near the bottom left of the keyboard’s “A” key (why so much there?) … hello). Who could call this website lame lame lame?!!
Link to input data file intensity_chart.csv
Link to output PDF Pie Chart data file intensity_chart_piechart.pdf
Link to output PDF Line Column chart data file intensity_chart_linecolumn.pdf
Link to output spreadsheet saved as webpage intensity_chart.html
Link to OpenOffice information … from Wikipedia as used by quote above.
Link to OpenOffice “spiritual home” … via Apache Software Foundation.
If this was interesting you may be interested in this too.




A fascinating technical exploration of video commentary timing and SubRip subtitle synchronization. In modern video pipelines, harmonizing visual frame duration with voiceover cadence is often where most editing effort goes. Seeing the programmatic breakdown of timestamped collaboration adds wonderful depth to media preparation tutorials. Excellent technical insight.