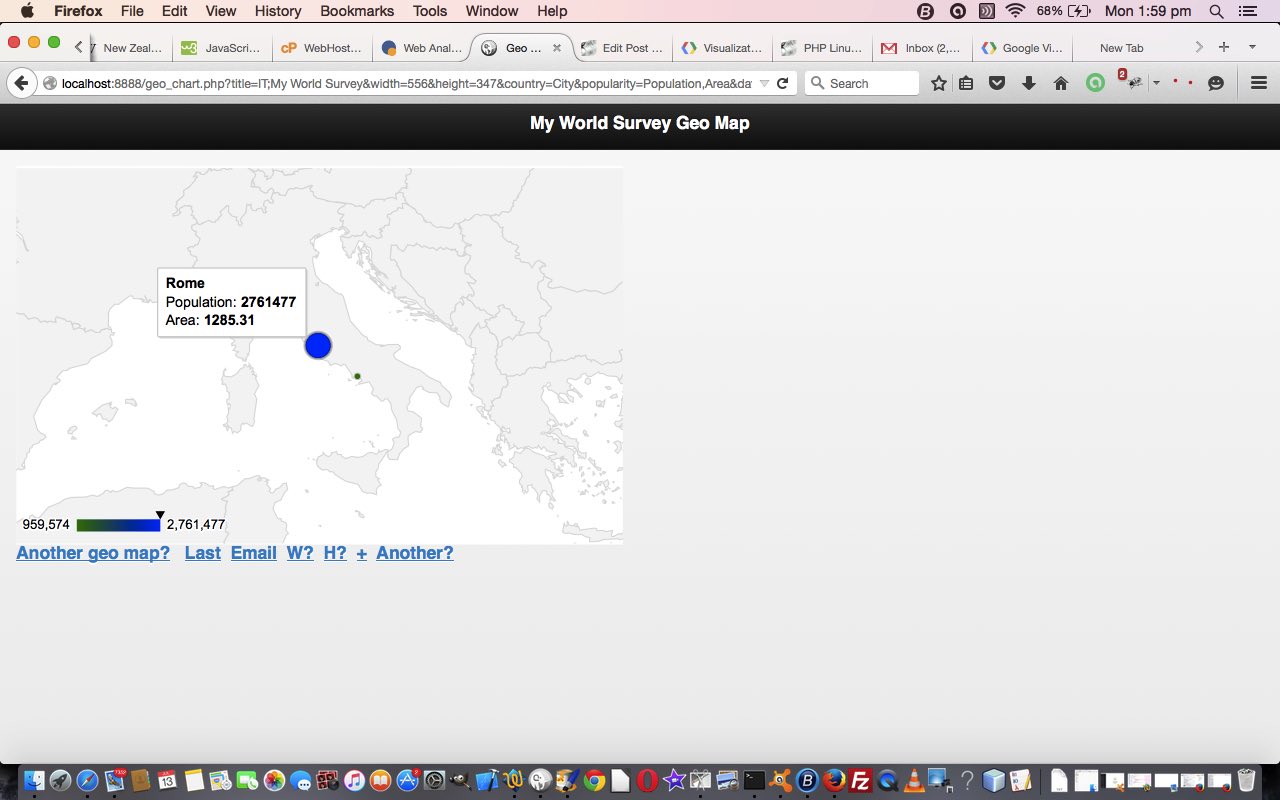
We’re returning to Google Graphs API, or Google Chart Tools, and its Geo Chart functionality as last talked about, specifically, with previous PHP/Javascript/HTML Google Chart Geo Chart Tutorial (as shown below), to develop, further, here, some improved functionality. Specifically we address …
- a way to allow for the use of Region Codes (please see this link for more information)
- a way to cater for a POST message from an HTML form (so that more data can be handled)
- a way to show a customised tooltip
The last two tooltip functionality improvements above, you may remember also being applied to a Candlestick Chart with PHP/Javascript Google Candlestick Waterfall Chart Tutorial yesterday and a Pie Chart with PHP and jQuery Google Pie Chart Tooltips Tutorial a couple of days back and to the Map Chart some days back when we published PHP/Javascript/HTML Google Chart Map Onclick Tutorial. As the weeks go on, others will also be attended to.
It is quite likely that now is a good time for you to consult the Geo (with Regions) Chart information page … via Google.
The Geo Chart’s tooltip (content) is heavily weighted towards a Country/Region attributes display, as you might expect, so we looked up whether other ideas can come into play and we stumbled upon this excellent webpage, for which we give hearty thanks.
If you’ve “digested” this information, you’ll see that it calls upon jQuery functionality to help out our usual Javascript client code for the Geo (with Regions) Charts. It is clever enough to allow an onmouseover (ie. hover event) tooltip to be able to handle HTML functionality, so you’ll see most of the changes to our PHP geo_chart.php code revolving around …
- effectively informing the user when they can intervene to tailor a tooltip (if combined with HTML content it can tailor the actual look of the Geo (with Regions) Chart as well, because it will show labels rather than percentages), and what they have to do, in general terms (just to set the pattern, for tailoring this, specifically (my favourite word for several days now), to your own requirements)
- validating this user entry data for what will suit the PHP program and its interface to the Google Chart API usage … lots of encodeURIComponent here!
… and the need to effectively refresh the page to allow the onclick “cementing” of the tooltip to allow for clicking off its (HTML) links.
Having optionally customised tooltips off the Geo (with Regions) Chart can be used to enhance its functionality considerably, should you be looking for the Geo (with Regions) Chart to be an interactive reporting tool, perhaps for collaboration purposes, as you can email your Geo (with Regions) Chart, as well, as we talked about with Google Charts Emailing Primer Tutorial.
So the PHP code changed from that emailing (Google Charts Emailing Primer Tutorial) functionality as per this link.
And so we’ll leave you with a link to a live run (as a GET method).
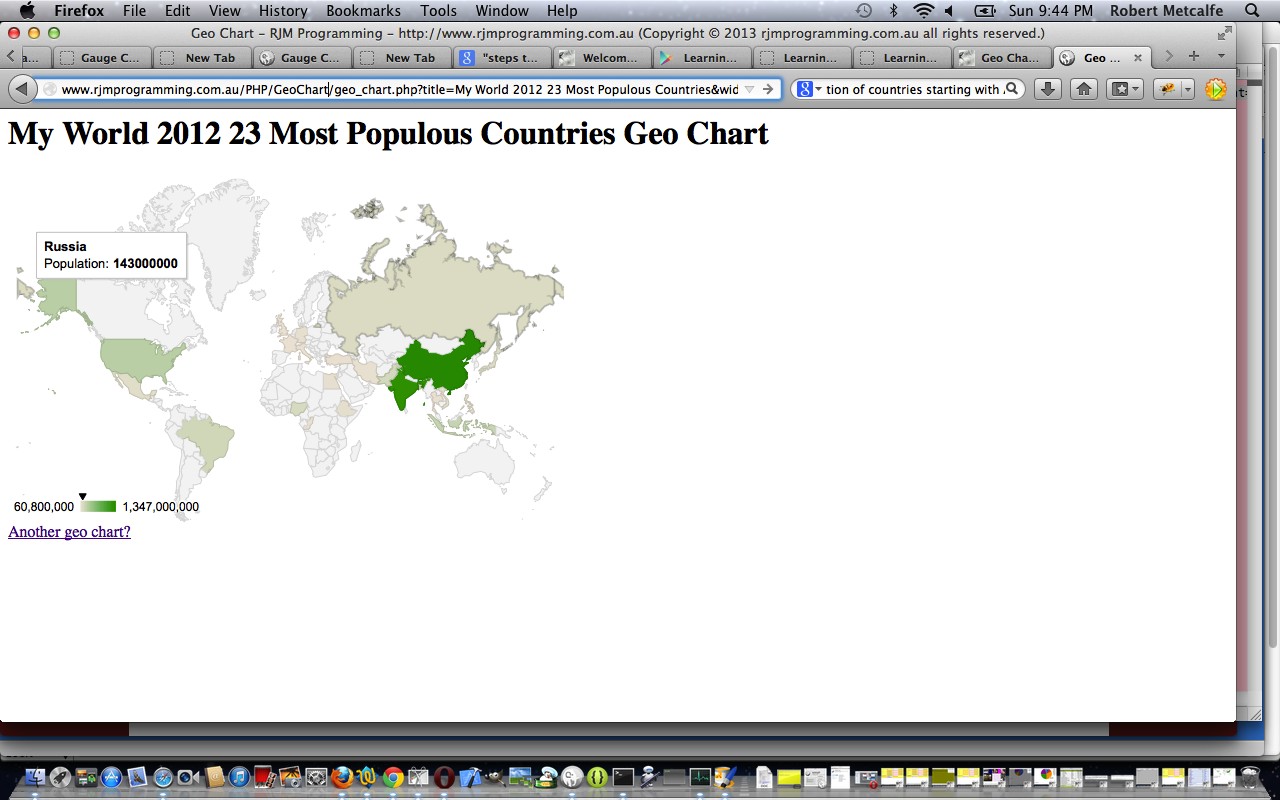
Previous relevant PHP/Javascript/HTML Google Chart Geo Chart Tutorial is shown below.
Here is a tutorial that introduces you to Google Graphs API, or Google Chart Tools, and its Geo Chart or Geo Map functionality.
Google Chart Tools provide a perfect way to visualize data on your website. From simple line charts to complex hierarchical tree maps, the chart galley provides a large number of well-designed chart types. Populating your data is easy using the provided client- and server-side tools.
Let’s see some PHP code in live action for this tutorial where you define your geo chart characteristics and data.
Link to Google Chart Tools “spiritual home” … via Google.
Link to Google Chart Tools Geo Chart information … via Google.
Now in Android App called Geo Chart++ in July 2013.
Link to some downloadable PHP programming code … rename to geo_chart.php.
If this was interesting you may be interested in this too.
If this was interesting you may be interested in this too.


