The Mac OS X Grapher utility desktop application is a great place to model your 3 dimensional designs. Today, we show you setting up the 3axes for this 3 dimensional modelling and then show some “z = [Equation in x and y]” equation plottings.
You get to play around with the look of the resultant complex curves easily before your ideas rather than laboriously plotting it out yourself.
Perhaps you are planning a 3 dimensional printing project, then using Grapher ahead of time, can give you the lead in to achieve the design you want to achieve before committing to the expense of the 3 dimensional printing processing.
And, for the mathematicians out there, they are always interested in solving such equations, often that being to determine where axes are crossed at their zero co-ordinate point. That can be visualized with Grapher, verifying (or not, we hope not) your mathematical endeavours on this front.
We’ve talked about Mac OS X’s Grapher before where we presented Grapher on Mac Primer Tutorial and you may want to consult this as well.
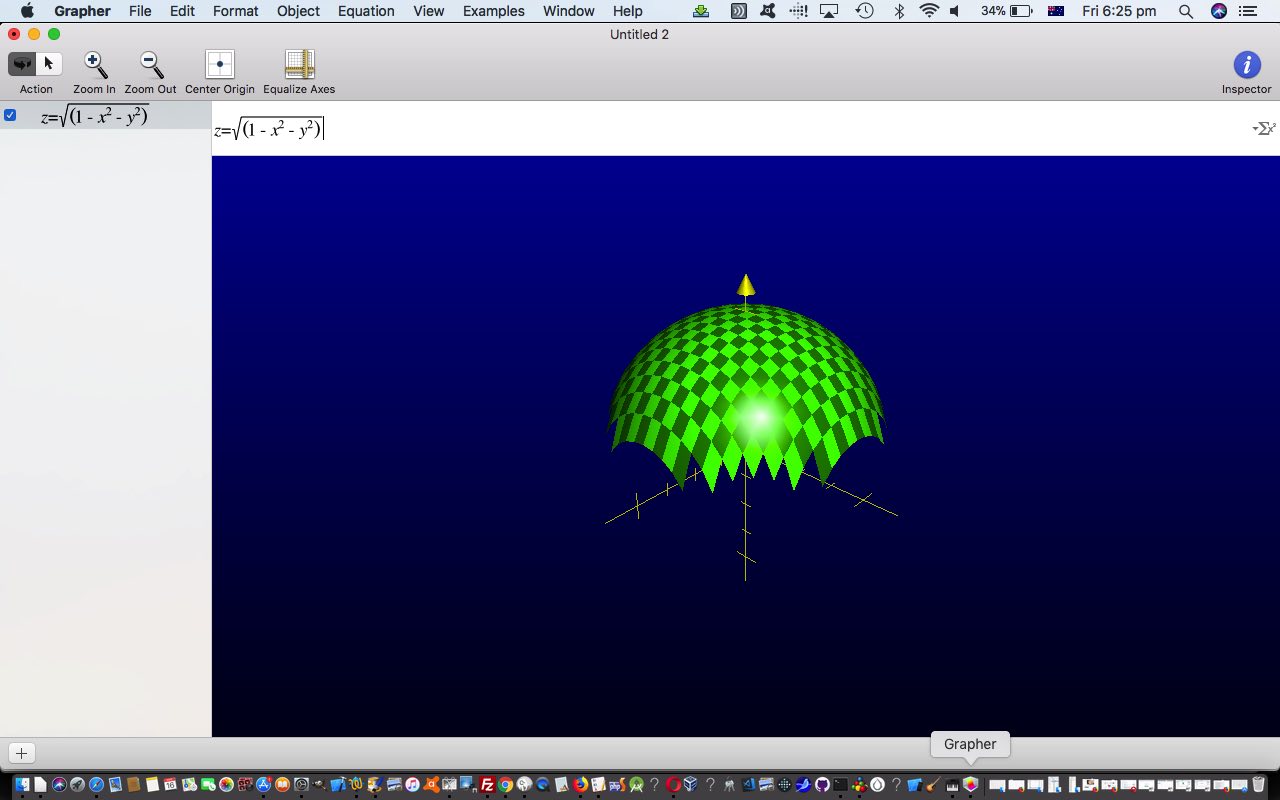
Just a few words about today’s tutorial picture. The equation you see is based on the formula for a sphere where r(adius) is 1 …
x2 + y2 + z2 = r2

⁂ if r = 1

z = (1 - x2 - y2)1/2
… else see more Grapher equation “play” below …
Previous relevant Grapher on Mac Primer Tutorial is shown below.
Here is a tutorial that introduces you to the Grapher utility application in Mac OS X, which is a tool useful for graphing mathematical functions, in the same vein as MATLAB (see also Freemat, a MATLAB clone, Primer Tutorial).
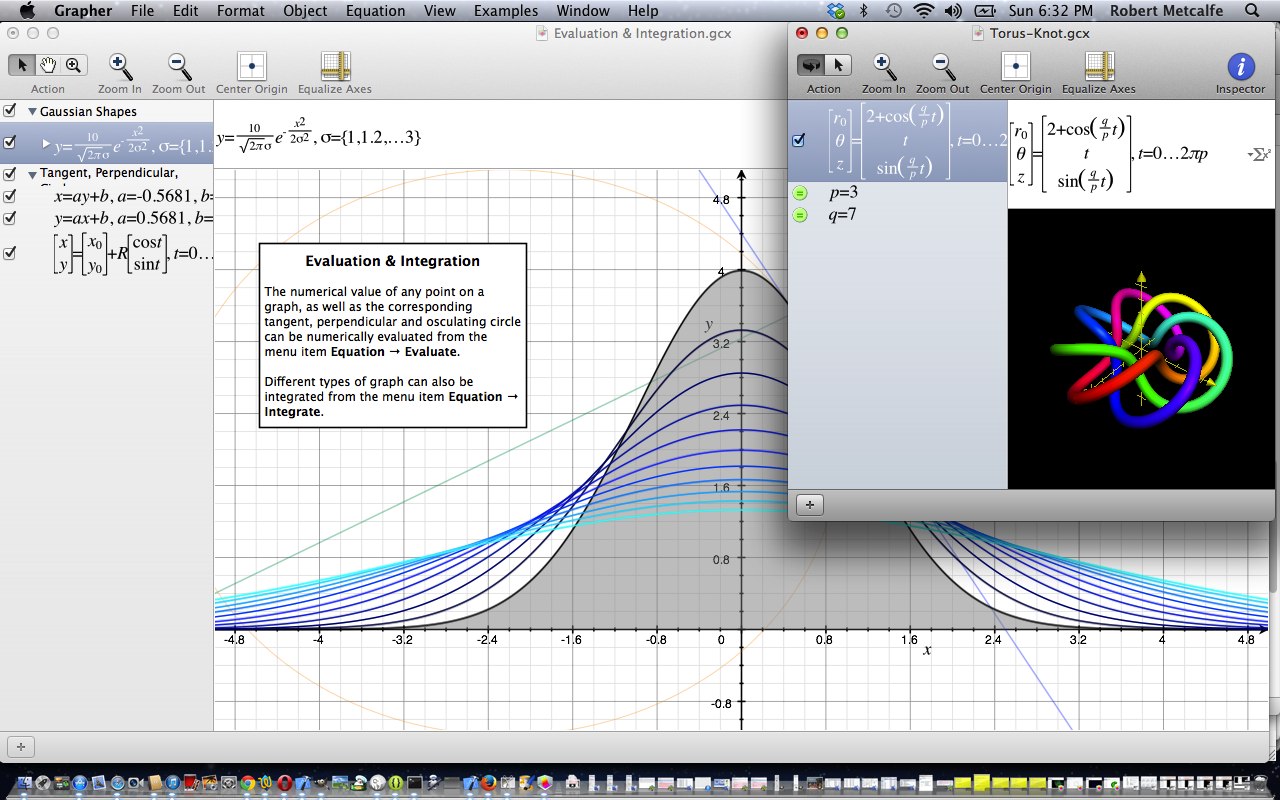
Grapher is a software program bundled with Mac OS X since version 10.4 that is able to create 2D and 3D graphs from simple and complex equations. It includes a variety of samples ranging from differential equations to 3D-rendered Toroids and Lorenz attractors. It is also capable of dealing with functions and compositions of them. One can edit the appearance of graphs by changing line colors, adding patterns to rendered surfaces, adding comments, and changing fonts and styles used to display them. Grapher is able to create animations of graphs by changing constants or rotating them in space.
Let’s see some simple Grapher application usage in Mac OS X.
Link to Mac OS X Grapher information … from Wikipedia from which quote above comes.
Link to Mac OS X Grapher information … from Apple (the company of Mac OS X and so the company of Grapher).
If this was interesting you may be interested in this too.
If this was interesting you may be interested in this too.


