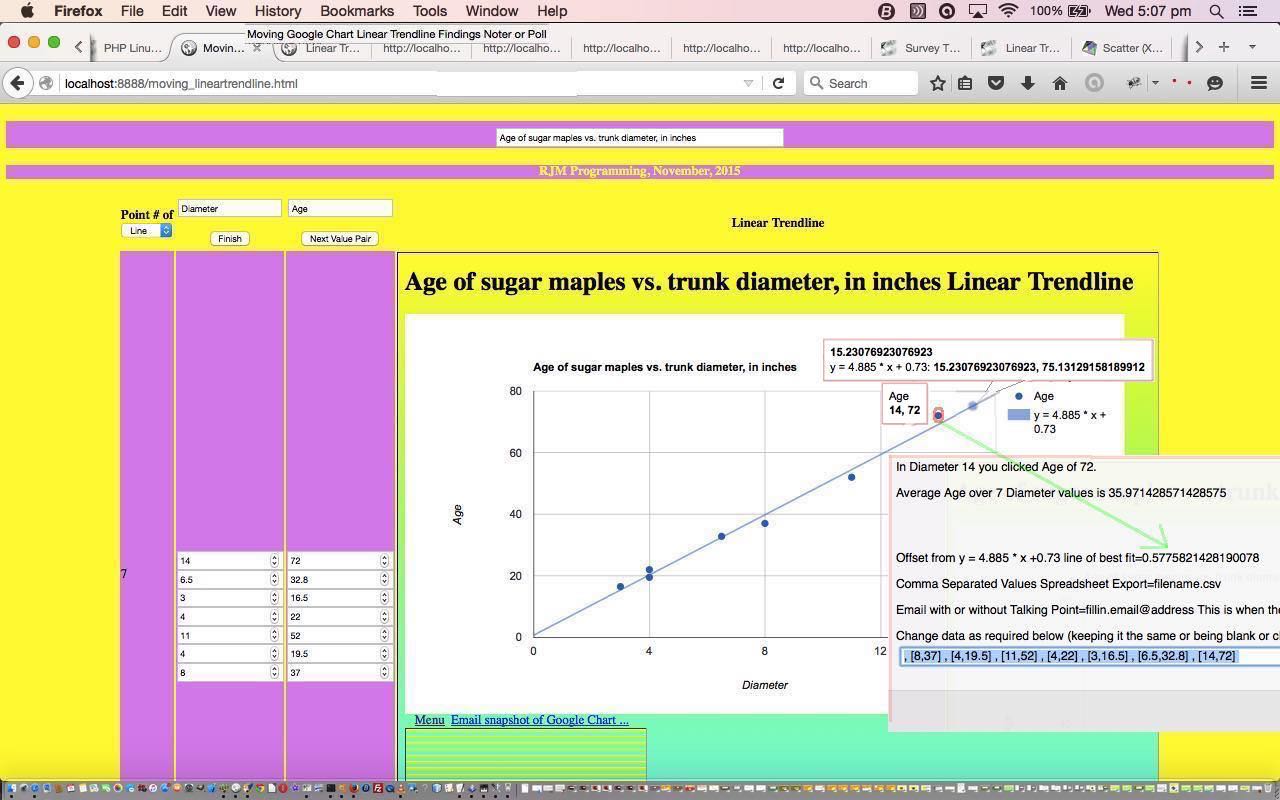
Mathematicians, scientists and engineers (like Land Surveyors), at the very least, know about error tolerance, and modelling data to a linear equation should they think the thing being measured should be linear by nature. Errors in measurement are rarely avoided, so the concept of a “line of best fit” in mathematics helps model real life “flawed” measurements to a close fitting mathematical model, that can then be used to interpolate, and extrapolate (within reason). Alas, extrapolating without reason, by people with an agenda, often clouds the issue of presenting the data in that rigorous mathematical form, when there is this error tolerance involved.
So that brings us to a really very useful Google Chart broadly categorized as Trendlines, and today we are going to just talk about Linear Trendlines, the data of which can be mathematically modelled by the equations …
y = Gradient * x + Offset
… that is used by presenting (x,y) co-ordinate pairs, and it will work out the “line of best fit” for you … cute, huh?!
Today’s tutorial uses these Google Chart Linear Trendline in an HTML iframe element to allow a “moving linear trendline” to be built up. Just as with the “moving histogram” of Survey Topic or Poll Histogram Primer Tutorial or the way by which you can calculate a “moving average”, at any point in time, it is possible to show an interim (perhaps), and perhaps complete (but maybe not) snapshot of the situation … pretty dynamic, huh?!
That approach may help you establish if your data is truly linear, by nature, or not, as you build it up, by seeing how neatly it gels with a linear “line of best fit”. In fact, with today’s work, we introduce into the Google Chart Linear Trendline a Google Chart “select” event functionality, calculating that offset of any data point to the Google Chart Linear Trendline “line of best fit”. And we use the code as of a couple of days back when were were calculating the distance of a data point from a polygon of an HTML area tag within an HTML map tag, when we presented ESL Vocabulary Getting Warmer Image Tutorial … as per …
- the problem boils down to being about one 3 co-ordinate (x,y) set represented by our data point (x,y) of interest and any two (x,y) co-ordinate sets on the “line of best fit” …
- for this co-ordinate set consider the three points as a triangle and use Heron’s Formula to calculate the triangle area
function herons_formula_triangle_area(xx1, yy1, xx2, yy2, xx3, yy3) {

  var a=Math.sqrt((xx1 - xx2) * (xx1 - xx2) + (yy1 - yy2) * (yy1 - yy2));

  var b=Math.sqrt((xx3 - xx2) * (xx3 - xx2) + (yy3 - yy2) * (yy3 - yy2));

  var c=Math.sqrt((xx3 - xx1) * (xx3 - xx1) + (yy3 - yy1) * (yy3 - yy1));

  var s=eval((a + b + c) / 2.0);

  return Math.sqrt(s * (s - a) * (s - b) * (s - c));

}
- the base value in “area=base x height / 2″ (area of a triangle) can be calculated as the line segment length (square root of the x co-ordinate difference squared plus the y co-ordinate difference squared)
function find_dist(x1, y1, x2, y2) {

  return Math.sqrt((x1 - x2) * (x1 - x2) + (y1 - y2) * (y1 - y2));

}
- so height=area x 2 / base …
function calcdist() {

  var area=0.0, base=0.0, height=0.0, smallesth=-1.0;

         area=herons_formula_triangle_area(x3, y3, x1, y1, x2, y2);

         base=find_dist(x1, y1, x2, y2);

         if (eval(base) > 0.001) {

         height=eval((2.0 * area) / base);

         }

         smallesth=height;

  return smallesth;

}
- and our shortest distance is this calculated offset above
Link to Google Chart Tools “spiritual home” … via Google.
Link to Google Chart Tools Linear Trendline information … via Google.
Codewise that leaves us with our HTML/Javascript supervisor web application you could call moving_lineartrendline.html (with its live run) supervising the PHP of the Google Chart Linear Trendline called linear_trendline.php (which can be run on its own as you wish), and which changed for Google Chart “select” event functionality as per this link.
This extra functionality, available via the suffix “&onclick=y” applied to the Google Chart Linear Trendline title, flows on directly to the iPad iOS App we created and talked about, last, with Xcode Swift iOS Application End Game Primer Tutorial.
Today we use a colour scheme involving violet and yellow with the web application, having read they often work well together. What do you think?
Previous relevant PHP/Javascript/HTML Google Chart Linear Trendline Tutorial is shown below.
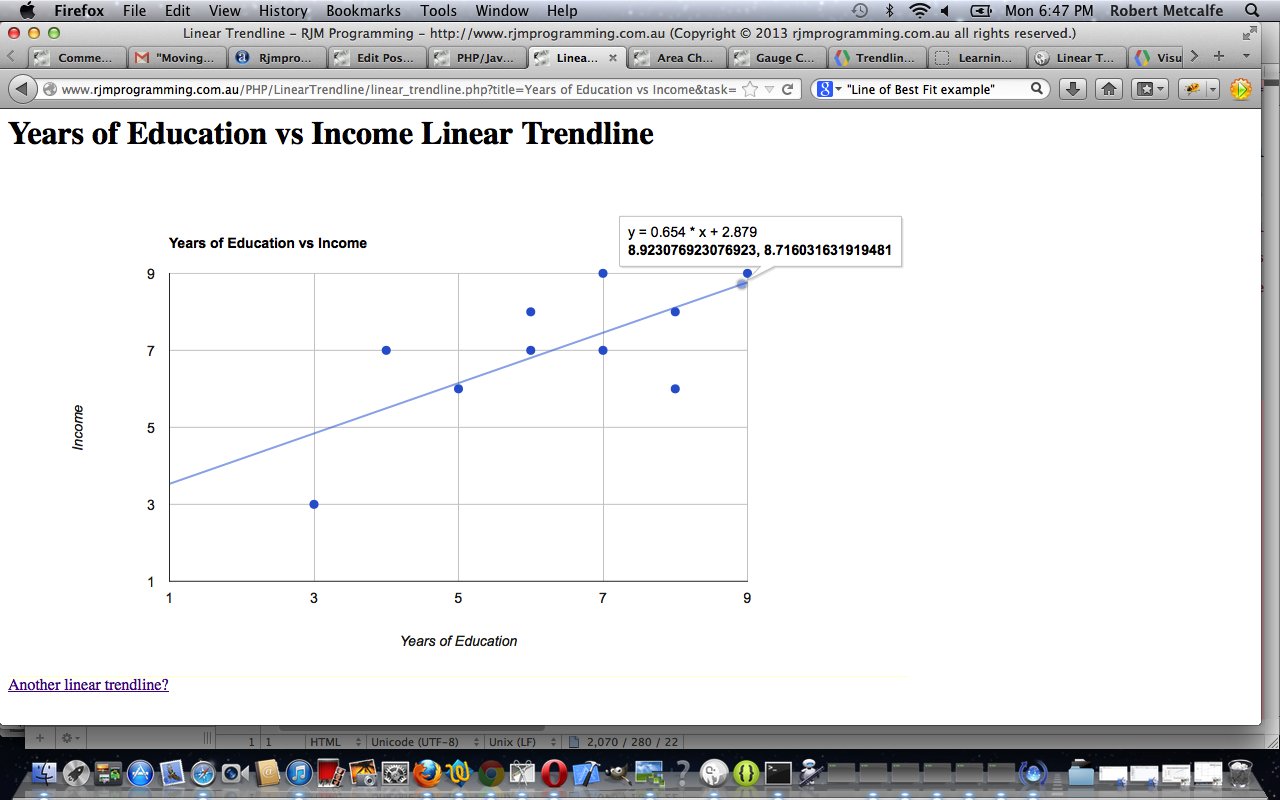
Here is a tutorial that introduces you to Google Graphs API, or Google Chart Tools, and its Linear Trendline functionality. For the data of picture above I give thanks to Action Research Projects.
Google Chart Tools provide a perfect way to visualize data on your website. From simple line charts to complex hierarchical tree maps, the chart galley provides a large number of well-designed chart types. Populating your data is easy using the provided client- and server-side tools.
This Linear Trendline illustrates Linear Regression (or “Line of Best Fit”) used a lot in Mathematics, Statistics, Economics, Engineering (for example, Land Surveying) and the Sciences. Read about it from Wikipedia below:
In statistics, linear regression is an approach to modeling the relationship between a scalar dependent variable y and one or more explanatory variables denoted X. The case of one explanatory variable is called simple linear regression. For more than one explanatory variable, it is called multiple linear regression. (This term should be distinguished from multivariate linear regression, where multiple correlated dependent variables are predicted,[citation needed] rather than a single scalar variable.)
In linear regression, data are modeled using linear predictor functions, and unknown model parameters are estimated from the data. Such models are called linear models. Most commonly, linear regression refers to a model in which the conditional mean of y given the value of X is an affine function of X. Less commonly, linear regression could refer to a model in which the median, or some other quantile of the conditional distribution of y given X is expressed as a linear function of X. Like all forms of regression analysis, linear regression focuses on the conditional probability distribution of y given X, rather than on the joint probability distribution of y and X, which is the domain of multivariate analysis.
Linear regression was the first type of regression analysis to be studied rigorously, and to be used extensively in practical applications. This is because models which depend linearly on their unknown parameters are easier to fit than models which are non-linearly related to their parameters and because the statistical properties of the resulting estimators are easier to determine.
Linear regression has many practical uses. Most applications fall into one of the following two broad categories:
If the goal is prediction, or forecasting, linear regression can be used to fit a predictive model to an observed data set of y and X values. After developing such a model, if an additional value of X is then given without its accompanying value of y, the fitted model can be used to make a prediction of the value of y.
Given a variable y and a number of variables X1, …, Xp that may be related to y, linear regression analysis can be applied to quantify the strength of the relationship between y and the Xj, to assess which Xj may have no relationship with y at all, and to identify which subsets of the Xj contain redundant information about y.Linear regression models are often fitted using the least squares approach, but they may also be fitted in other ways, such as by minimizing the “lack of fit” in some other norm (as with least absolute deviations regression), or by minimizing a penalized version of the least squares loss function as in ridge regression. Conversely, the least squares approach can be used to fit models that are not linear models. Thus, although the terms “least squares” and “linear model” are closely linked, they are not synonymous.
Let’s see some PHP code in live action for this tutorial where you define your linear trendline characteristics and data.
Link to Google Chart Tools “spiritual home” … via Google.
Link to Google Chart Tools Linear Trendline information … via Google.
Link to some downloadable PHP programming code … rename to linear_trendline.php.
If this was interesting you may be interested in this too.
If this was interesting you may be interested in this too.


I have recently started a web site, the information you provide on this website has helped me tremendously. Thank you for all of your time & work. “Money is power, freedom, a cushion, the root of al evil, the sum of all blessings.” by Carl Sandburg.
It’s really an awesome and valuable piece of data. I’m glad which you basically shared this useful information with us. Please hold us informed like this. Thanks for sharing.
After I start out your Rss feed it appears to become a ton of junk, would be the problem on my side?
I feel this is among the so much significant info for me. And i am happy reading your article. But want to remark on some normal issues, The site style is great, the articles is in point of fact nice : D. Just right job, cheers|
Supporting the page.. thanks a bunch So happy to have located this publish.. Terrific thoughts you have here.. So content to get discovered this publish..
Very helpful viewpoint, many thanks for posting.. Excellent beliefs you’ve got here.. So happy to have discovered this publish.. Take pleasure in the entry you delivered..
thank you very much
Your area is valueble for me. Thanks !?