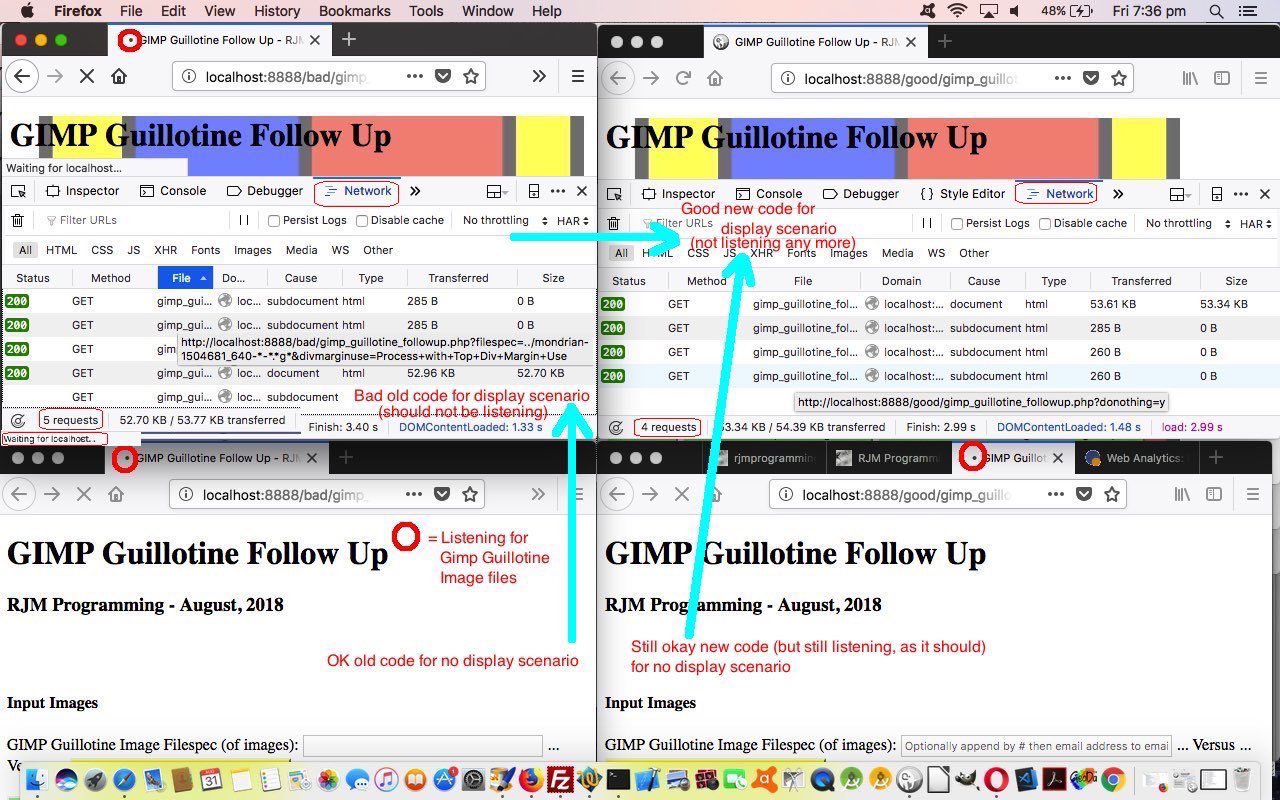
It doesn’t always matter that you are debugging a serverside piece of code like with PHP, a client facing web inspector like Firefox (web browser)’s Inspector (via Three Horizontal Lines Menu -> Web Developer -> Inspector) can be a good tool to debug an issue. That being said, we’d never come across an issue where its usage involved the Firefox Inspector’s Network tab, rather than the usual Console tab solution.
The Console tab is the main debugging friend because it displays any errors resulting from the HTML and Javascript of the HTML of the webpage involved. But what about if the issue …
- shows no errors on the webpage you are on … but rather is an issue of navigation …
- either involving extra “calls” on the webpage you are on … our case today … or involving the navigation issues getting to the next webpage (we’re guessing could cause the “Network” tab to be useful also)
What are the symptoms of this ‘involving extra “calls” on the webpage you are on’?
- could be that you see the content you were expecting but that the progress indicators below the address bar show continued activity as does …
- window.status down the bottom left shows (something like) …
- Waiting for localhost
- Transferring data from localhost
… contributing to an overall impression as if …
- it can feel like the webpage is hanging (and indeed the web browser may flag this and ask if you want to close a “Slow Webpage”)
So supposing you can rule out in the code that a return value is not attended to, and that there are no errors occurring in the Console tab of the Firefox Inspector, what next? Well, it took us a while, but perhaps we can alleviate your pain one day and recommend you open the Firefox Inspector’s “Network” tab and take a look at the “calls” made (ie. the “navigational” aspects to how the webpage behaves). And there it was for us. We expect two types of behaviour with our recent Gimp Guillotine Follow Up (of Gimp Guillotine Follow Up Canvas Tutorial and how we got to make these changes), those being …
- in default mode it shows a form and could be listening out for Gimp Guillotine image files created there and then (as per the original design talked about in the Primer tutorial) … or …
- if imagery to display, do that and show the same form talked about in point above, but not listen out for Gimp Guillotine image files created there and then … hopefully?!
But what did we find Firefox Inspector in “Network” tab debugging our scenario 2 above, at a time when it was misbehaving in that “hanging” fashion? It was “listening out for Gimp Guillotine image files created there and then”, alas. We saw this in the “Network” tab clear as day.
And how did we create today’s fade in, fade out video via the 5 screenshot images we started with? With great help from this great webpage, thanks …
ffmpeg -loop 1 -t 5 -i gimp_debug-1.jpg -loop 1 -t 5 -i gimp_debug-2.jpg -loop 1 -t 5 -i gimp_debug-3.jpg -loop 1 -t 5 -i gimp_debug-4.jpg -loop 1 -t 5 -i gimp_debug-5.jpg -filter_complex "[0:v]fade=t=out:st=4:d=1[v0]; \

 [1:v]fade=t=in:st=0:d=1,fade=t=out:st=4:d=1[v1]; \

 [2:v]fade=t=in:st=0:d=1,fade=t=out:st=4:d=1[v2]; \

 [3:v]fade=t=in:st=0:d=1,fade=t=out:st=4:d=1[v3]; \

 [4:v]fade=t=in:st=0:d=1,fade=t=out:st=4:d=1[v4]; \

 [v0][v1][v2][v3][v4]concat=n=5:v=1:a=0,format=yuv420p[v]" -map "[v]" gimp_debug.mp4
If this was interesting you may be interested in this too.


